
FIGURE
FIGURE 10
- ID
- ZDB-FIG-221226-47
- Publication
- Wei et al., 2022 - Curcumae Rhizoma - combined with Sparganii Rhizoma in the treatment of liver cancer: Chemical analysis using UPLC-LTQ-Orbitrap MSn, network analysis, and experimental assessment
- Other Figures
- All Figure Page
- Back to All Figure Page
FIGURE 10
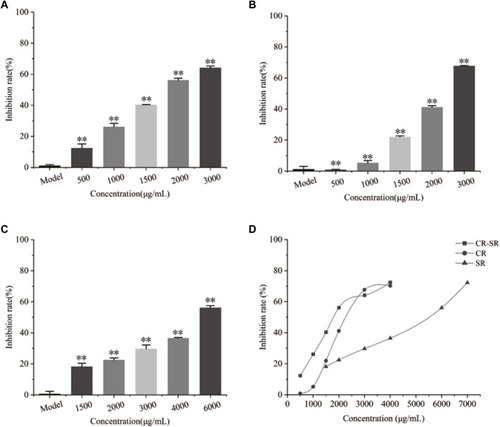
Inhibitory effects on the proliferation rate of HepG2 cells. **p < 0.01 compared with the model group. (A) Chart of CR-SR, (B) chart of CR, (C) chart of SR, and (D) line chart of CR-SR, CR, and SR. |
Expression Data
Expression Detail
Antibody Labeling
Phenotype Data
Phenotype Detail
Acknowledgments
This image is the copyrighted work of the attributed author or publisher, and
ZFIN has permission only to display this image to its users.
Additional permissions should be obtained from the applicable author or publisher of the image.
Full text @ Front Pharmacol