
Image
|
Figure Caption
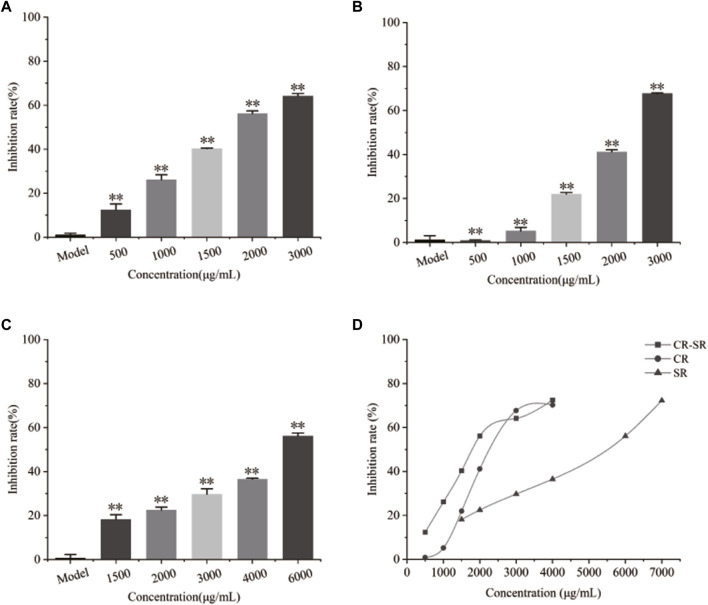
FIGURE 10 Inhibitory effects on the proliferation rate of HepG2 cells. **p < 0.01 compared with the model group. (A) Chart of CR-SR, (B) chart of CR, (C) chart of SR, and (D) line chart of CR-SR, CR, and SR.
Acknowledgments
This image is the copyrighted work of the attributed author or publisher, and
ZFIN has permission only to display this image to its users.
Additional permissions should be obtained from the applicable author or publisher of the image.
Full text @ Front Pharmacol