
FIGURE
FIGURE 7
- ID
- ZDB-FIG-221226-44
- Publication
- Wei et al., 2022 - Curcumae Rhizoma - combined with Sparganii Rhizoma in the treatment of liver cancer: Chemical analysis using UPLC-LTQ-Orbitrap MSn, network analysis, and experimental assessment
- Other Figures
- All Figure Page
- Back to All Figure Page
FIGURE 7
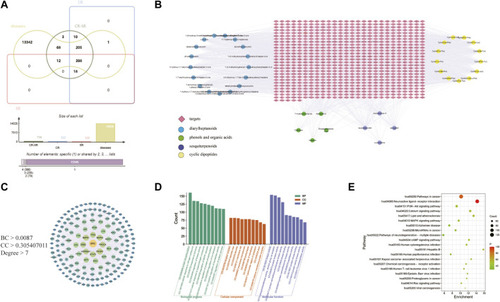
Network pharmacology of CR-SR in liver cancer treatment. (A) Venn diagram of active compound targets of CR-SR, CR, SR with liver cancer targets. (B) Active compound-target network of the overlapping targets between CR-SR and liver cancer (targets as orange diamond nodes; diarylheptanoids as blue circle nodes; phenols and organic acids as green circle nodes; sesquiterpenoids as purple circle nodes; cyclic dipeptides as yellow circle nodes. (C) The PPI network of the screening targets. (D) Go enrichment analysis (top 10). (E) Bubble diagram of enrichment analysis of KEGG pathway (top 20). |
Expression Data
Expression Detail
Antibody Labeling
Phenotype Data
Phenotype Detail
Acknowledgments
This image is the copyrighted work of the attributed author or publisher, and
ZFIN has permission only to display this image to its users.
Additional permissions should be obtained from the applicable author or publisher of the image.
Full text @ Front Pharmacol