
Fig. 3
- ID
- ZDB-FIG-221226-33
- Publication
- Tanimoto et al., 2022 - Tiltable objective microscope visualizes selectivity for head motion direction and dynamics in zebrafish vestibular system
- Other Figures
- All Figure Page
- Back to All Figure Page
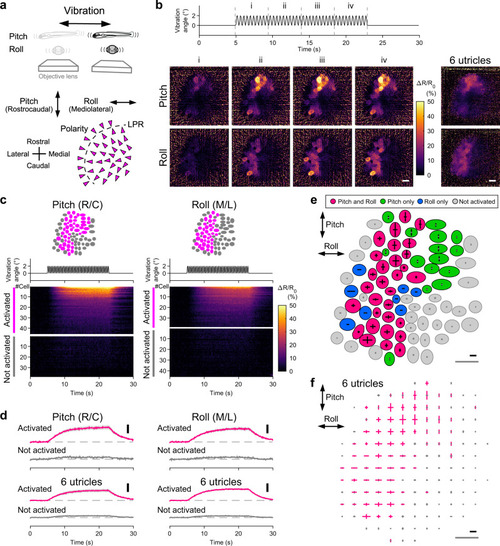
In vivo Ca2+ imaging visualizes a subset of utricular HCs receiving head vibration.
a Schematic showing imaging of utricular HCs during vibration in pitch/roll axis (top). Hair-bundle polarity (arrowheads) and vibration axes (double-headed arrows) (bottom). The same orientation applies to (b), (c), (e), and (f). b Example of HC responses to vibration stimulus in pitch and roll axes (see Supplementary Movie 4). Vibration time course (top). Sequential images showing mean ΔR/R0 responses during the time period “i” to “iv” (left). Average of 8 trials. Organ-average of the mean ΔR/R0 responses during the time period “iv” in 6 utricles (right). Scale bar: 10 μm. c Example of vibration responses per HC. The same utricle shown in (b). Responses to pitch (left) and roll (right) vibration. HC location (top). Vibration time course (middle). ΔR/R0 per HC (bottom). R/C: rostrocaudal; M/L: mediolateral. d Mean ΔR/R0 time course in HC groups in (c) (top). Pitch: 45 cells activated; 38 cells not activated. Roll: 38 cells activated; 45 cells not activated. Mean of the 6 utricles (bottom). Deviation (SEM) is shown in gray. Vibration time course is the same as in C. Scale bar: 10% ΔR/R0. R/C: rostrocaudal; M/L: mediolateral. Example (e: the same utricle shown in [b]) and summary (f) of HC response vectors. Orientation of bars indicates stimulus direction. Length of bars indicates ΔR/R0 amplitude (e) or mean amplitude per grid that is larger (magenta) or not larger (gray) than 5% (f, see “Methods”). Black scale bar: 20% ΔR/R0. Gray scale bar: 10 μm. Source data are provided as a Source Data file. |