
Fig. 1
- ID
- ZDB-FIG-221226-31
- Publication
- Tanimoto et al., 2022 - Tiltable objective microscope visualizes selectivity for head motion direction and dynamics in zebrafish vestibular system
- Other Figures
- All Figure Page
- Back to All Figure Page
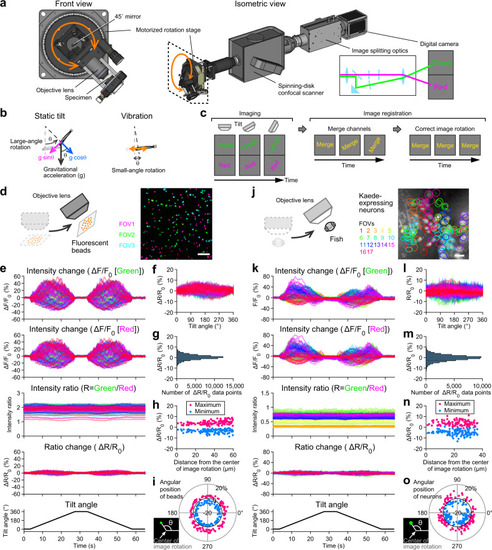
Tiltable objective microscope enables functional imaging during 360° static tilt and vibration.
a Schematic showing a tiltable objective microscope. An objective lens and a specimen are tilted by a motorized rotation stage (see Supplementary Movie 1). b Gravitational vector components (magenta and blue arrows) during static tilt produced by large-angle, slow rotation (left). Inertial acceleration during vibration (orange arrows) produced by small-angle, fast rotation (right) (see Supplementary Fig. 1). c Rotated images are merged and registered by correcting the image rotation (see Supplementary Movie 2 and “Methods”). d Fluorescent beads. Images from 3 fields of view (FOVs) are superimposed. Scale bar: 20 μm. e Time course of beads fluorescent intensity changes during 360° tilt. Large fluctuation in green and red signals is reduced in ratio and ratio change (ΔR/R0). 116 beads from 3 FOVs. f Relationship between tilt angle and ΔR/R0. g Distribution of ΔR/R0 values during tilt. h Relationship between beads distance from the center of image rotation, which is the center of the image in [d], and ΔR/R0 maximum (red) and minimum (blue). i Relationship between the angular position of beads around the center of image rotation, which is the center of the image in [d], and ΔR/R0 maximum (red) and minimum (blue). j Brain neurons expressing green- and red-Kaede in Tg(nefma-hs:Gal4; UAS:Kaede) larval zebrafish at 5 dpf. Images from 17 FOVs are superimposed. Red channel is shown in grayscale. Positions of neurons are labeled by FOV colors. Scale bar: 10 μm. k Time course of neuronal fluorescent intensity changes during 360° tilt. Large fluctuation in green and red signals is reduced in ratio and ΔR/R0. 116 neurons from 17 FOVs. l Relationship between tilt angle and ΔR/R0. m Distribution of ΔR/R0 values during tilt. n Relationship between neuron distance from the center of image rotation, which is the center of the image in [j], and ΔR/R0 maximum (red) and minimum (blue). i Relationship between angular position of neurons around the center of image rotation, which is the center of the image in [j], and ΔR/R0 maximum (red) and minimum (blue). Source data are provided as a Source Data file. |