
FIGURE
Fig. 3
- ID
- ZDB-FIG-221222-17
- Publication
- Akula et al., 2021 - Analysis of the mast cell expressed carboxypeptidase A3 and its structural and evolutionary relationship to other vertebrate carboxypeptidases
- Other Figures
- All Figure Page
- Back to All Figure Page
Fig. 3
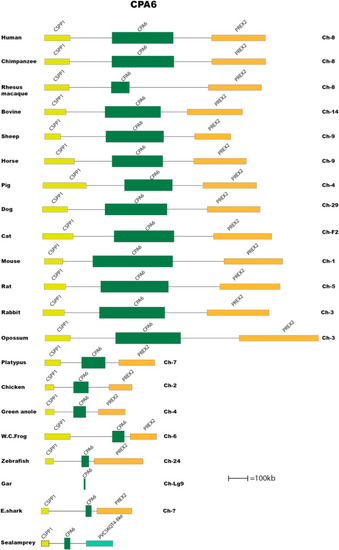
Fig. 3. The CPA6 gene locus. The genes encoding CPA6 are depicted in double-height to easily locate them in the maps. The bordering genes are included to trace the origin of the locus and to also define changes that have occurred upstream or downstream of the locus. Gene names for the carboxypeptidases, as given in the database. The CPA6 gene is depicted in dark green. The bordering genes deposited in different colors to easily distinguish. |
Expression Data
Expression Detail
Antibody Labeling
Phenotype Data
Phenotype Detail
Acknowledgments
This image is the copyrighted work of the attributed author or publisher, and
ZFIN has permission only to display this image to its users.
Additional permissions should be obtained from the applicable author or publisher of the image.
Full text @ Dev. Comp. Immunol.