
Fig. 2
- ID
- ZDB-FIG-221222-16
- Publication
- Akula et al., 2021 - Analysis of the mast cell expressed carboxypeptidase A3 and its structural and evolutionary relationship to other vertebrate carboxypeptidases
- Other Figures
- All Figure Page
- Back to All Figure Page
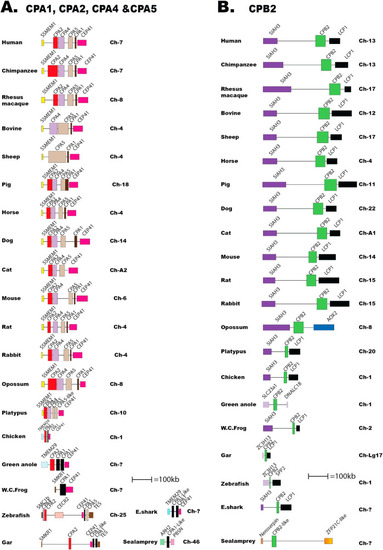
Fig. 2. The two loci for CPA1, CPA2, CPA4 and CPA5 and for CPB2. The genes encoding carboxypeptidases are depicted in double-height to easily locate them in the maps. The bordering genes are included to trace the origin of the locus and to also define changes that have occurred upstream or downstream of the locus. Gene names for the carboxypeptidases, as given in the database. Panel A shows the locus encoding the CPA cluster with the genes CPA1, CPA2, CPA4 and CPA5. The CPA2 genes are depicted in red, the CPA4 in purple, the CPA5 in beige and the CPA1 in black. The bordering genes are depicted in different colors to easily distinguish them from each other and from the CPs. Panel B; shows the CPB2 locus. The CPB2 gene is depicted in light green. |