
Fig. 6
- ID
- ZDB-FIG-221216-19
- Publication
- Spelat et al., 2022 - Metabolic reprogramming and membrane glycan remodeling as potential drivers of zebrafish heart regeneration
- Other Figures
- All Figure Page
- Back to All Figure Page
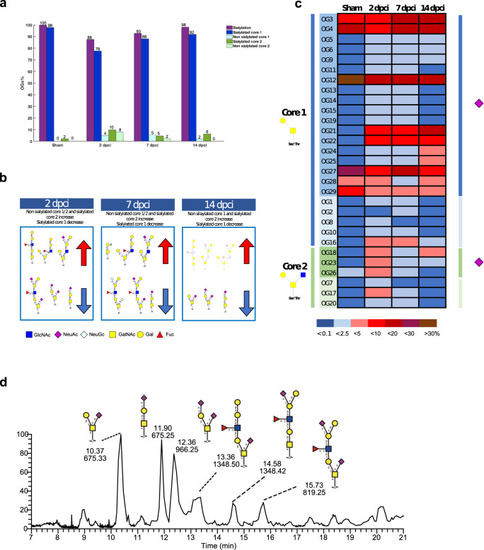
Membrane O-glycan profile of regenerating zebrafish heart established by LC-MS/MS revealed decreased sialylation during the inflammatory phase.
a Comparison of O-glycan structures (core 1 and core 2) and sialylation between sham and the different regeneration phases (2, 7 and 14 dpci). The inflammatory phase (2 dpci) showed a 12% decrease in sialylated O-glycans and a subsequent increase at 7 and 14 dpci. b Summary of the main changes in O-glycan structures (sialylated core 1/2 increase/decrease, non-sialylated core 1/2 increase/decrease) showing some of the corresponding structures. c Heatmap displaying time-specific relative quantification of core 1 and core 2 O-glycans. Sialylated structures are also indicated (purple square). Color intensity represents the relative abundance expressed as a percentage. d EIC showing the most abundant membrane O-glycans present in zebrafish heart. Results deriving from samples from the pooling of six animals are shown (n = 6 animals per group). |