
|
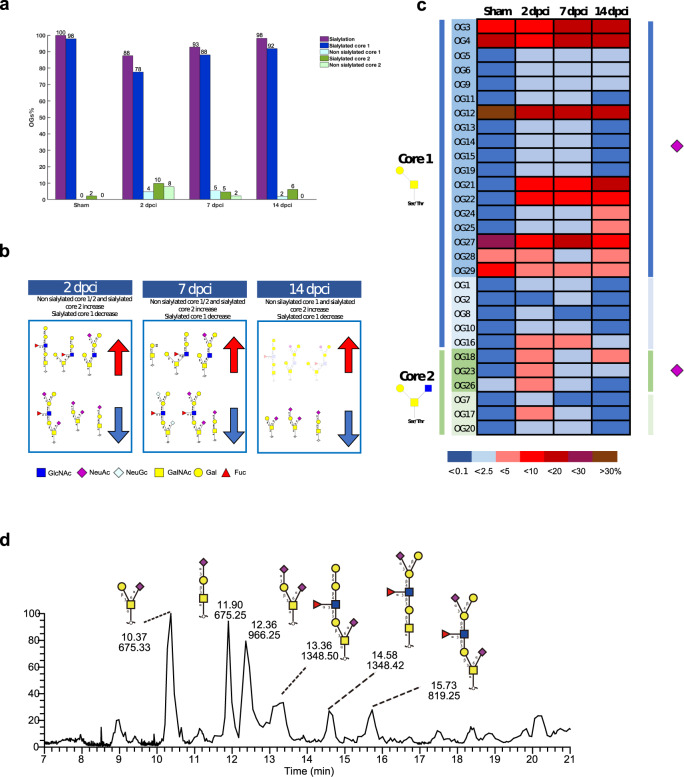
Fig. 6
a Comparison of O-glycan structures (core 1 and core 2) and sialylation between sham and the different regeneration phases (2, 7 and 14 dpci). The inflammatory phase (2 dpci) showed a 12% decrease in sialylated O-glycans and a subsequent increase at 7 and 14 dpci. b Summary of the main changes in O-glycan structures (sialylated core 1/2 increase/decrease, non-sialylated core 1/2 increase/decrease) showing some of the corresponding structures. c Heatmap displaying time-specific relative quantification of core 1 and core 2 O-glycans. Sialylated structures are also indicated (purple square). Color intensity represents the relative abundance expressed as a percentage. d EIC showing the most abundant membrane O-glycans present in zebrafish heart. Results deriving from samples from the pooling of six animals are shown (n = 6 animals per group).