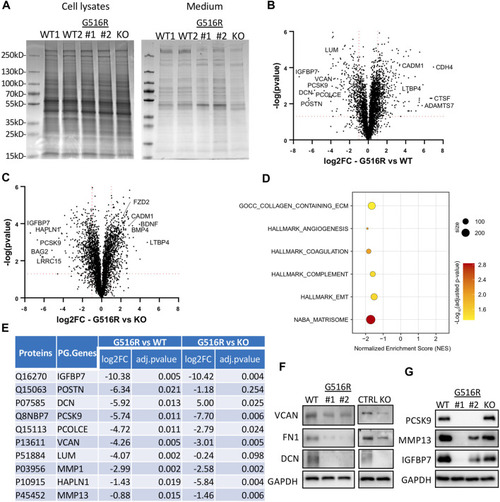
Secretome analysis of WT, COG4p.G516R, and COG4-KO chondrosarcoma cells. (A) Coomassie blue staining of proteins in cell lysates and conditioned medium from COG4p.G516R clones #1, #2, WT controls and COG4 KO cells. (B) Volcano plot of differentially secreted proteins between COG4p.G516R and WT. (C) Volcano plot of differentially secreted proteins between COG4p.G516R and COG4-KO cells. A few top candidates confirmed by pathway analysis were labeled respectively. (D) Dot plot showing enriched pathways from Gene Set Enrichment Analysis with the Normalized Enrichment Score (NES) shown on the X-axis. The size of the dots represents the number of genes in the significant Data Set list associated with the GO term and the color of the dots represent the adjusted p- values. (E) Table showing a list of top 10 candidates which were decreased in secretions of COG4p.G516R with log 2 (Fold Change) and adjusted p-value shown for COG4p.G516R vs. WT and COG4p.G516R vs. COG4-KO. The number of peptides is equal to or more than two for all the candidates shown in table. (F) Western blotting of top candidates in medium decreased in both COG4p.G516R and COG4-KO cells compared to WT. GAPDH was from cell lysates with comparable amount as loading control. (G) Western blotting of top candidates only changed in COG4p.G516R compared to WT and COG4-KO cells. All experiments were performed in duplicate with similar results.
|
