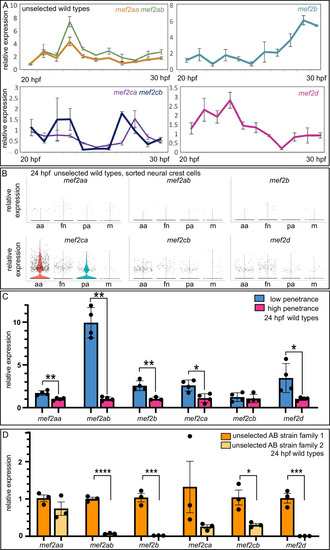
(A) Wild-type head expression of all mef2 paralogs was quantified by RT-quantitative PCR (qPCR) at 1 hr intervals from 20 to 30 hpf. Expression of each paralog was normalized to rps18. Error bars are SD. (B) Expression of each paralog in cranial neural crest cells at 24 hpf was determined by single cell RNA-sequencing on sorted cells. Seurat-based clustering subdivided the cells into four populations as described (Mitchell et al., 2021): anterior arches (aa), frontonasal (fn), posterior arches (pa), and a satellite population containing melanocyte lineage cells (m). (C) Wild-type head expression of all mef2 paralogs was quantified by RT-qPCR at 24 hpf to compare paralog expression levels between the low- and high-penetrance strains. Expression of each paralog was normalized to rps18. Asterisks indicate significant difference (*≤0.05 and **≤0.01). Error bars are SD. (D) Wild-type head expression of all mef2 paralogs was quantified by RT-qPCR at 24 hpf to compare paralog expression levels between two families from the unselected AB strain. Expression of each paralog was normalized to rps18. Asterisks indicate significant difference (*≤0.05, ***≤0.001, and ****≤0.0001). Error bars are SEM.