
Figure 2
- ID
- ZDB-FIG-221018-14
- Publication
- Deng et al., 2022 - Zbtb14 regulates monocyte and macrophage development through inhibiting pu.1 expression in zebrafish
- Other Figures
- All Figure Page
- Back to All Figure Page
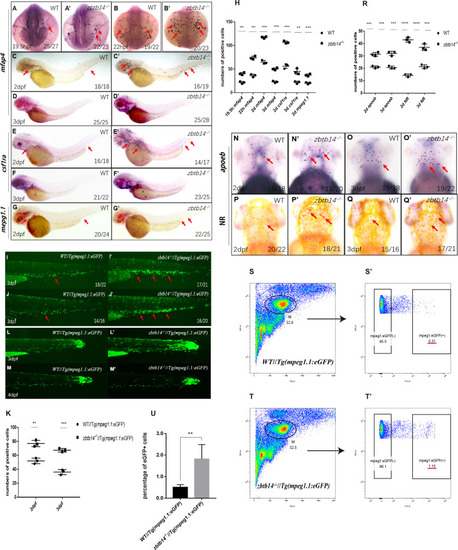
(A–G’) Whole-mount in situ hybridization (WISH) analyses of macrophage markers mfap4 (A–D’), csf1ra (E–F’), mpeg1.1 (G, G’) from 19.5 hr post-fertilization (hpf) to 3 days post-fertilization (dpf) in wild type (WT) and zbtb14-deficient embryos and larvae. Red arrows indicate the main positions of positive cells for each marker. n/n, number of embryos/larvae showing representative phenotype/total number of embryos/larvae examined. (H) Statistical results for A–G’ (Student’s t test, N=3, 14–28 embryos were used for each probe. Each dot represents the mean value of one experiment, which was obtained from the counts of all of the embryos/larvae in the same group. Error bars represent mean ± standard error of the mean (SEM). **p<0.01, ***p<0.001, ****p<0.0001). (I–J’) GFP positive cells were increased in zbtb14-/-//Tg(mpeg1.1:eGFP) embryos at 2 and 3 dpf. (K) Statistical results for I–J’ (Student’s t test, N=3, 14–22 larvae were used for each experiment. Each dot represents the mean value of one experiment. Error bars represent mean ± SEM. **p<0.01, ***p<0.001). (L–M’) GFP positive cells in both Tg(mpeg1.1:eGFP) and zbtb14-/-//Tg(mpeg1.1:eGFP) larvae can migrate to the wound. (N–Q’) apoeb and neutral red positive cells were both increased in zbtb14-deficient larvae at 2 and 3 dpf. (R) Statistical results for N–Q’ (Student’s t test, N=3, 15–22 larvae were used for each experiment. Each dot represents the mean value of one experiment. Error bars represent mean ± SEM. ***p<0.001, ****p<0.0001). (S–T’) Representative scatterplot generated by FACS analysis of WKM samples collected from WT Tg(mpeg1.1:eGFP) (up panel) and zbtb14-/-//Tg(mpeg1.1:eGFP) (bottom panel) zebrafish lines in 4-month-old adults. M: myeloid gate. (U) Statistical results for S–T’ in WT Tg(mpeg1.1:eGFP) and zbtb14-/-//Tg(mpeg1.1:eGFP) zebrafish. (Student’s t test, N=4, each time one male and one female were used in the WT and mutant groups. Error bars represent mean ± SEM. **p<0.01).
|