|
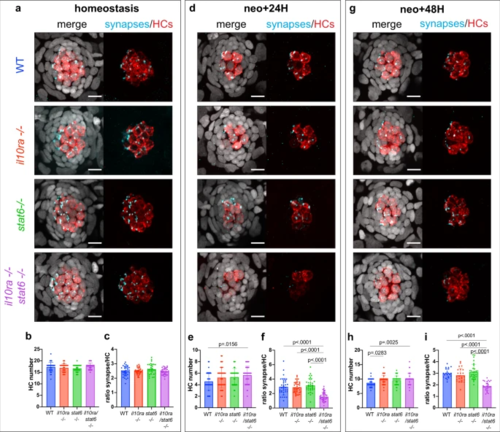
a, d, g Representative confocal images (maximum projection of a 10 μm z-stack) of the HC and efferent synapse regeneration assay. b, e, h Quantification of HC numbers during (b) homeostasis, (e) 24H after HC death and (h) 48H after HC death (11–14 larvae per condition, 3 neuromasts per larvae and 4 biological replicates). c, f, i Quantification of the number of efferent synapses per HC (ratio) during (c) homeostasis, (f) 24 h after HC death and (i) 48H after HC death (8–14 larvae per condition, 3 neuromasts per larvae and 4 biological replicates). A 2-way ANOVA followed by a Tukey multiple comparison test has been used to determine statistical significance. P-values represent a post-hoc test (Tukey) between each condition. For all graphs, data are represented as mean ± SD.
|