
Fig. 1
- ID
- ZDB-FIG-220916-6
- Publication
- Mendieta-Serrano et al., 2022 - Slow muscles guide fast myocyte fusion to ensure robust myotome formation despite the high spatiotemporal stochasticity of fusion events
- Other Figures
- All Figure Page
- Back to All Figure Page
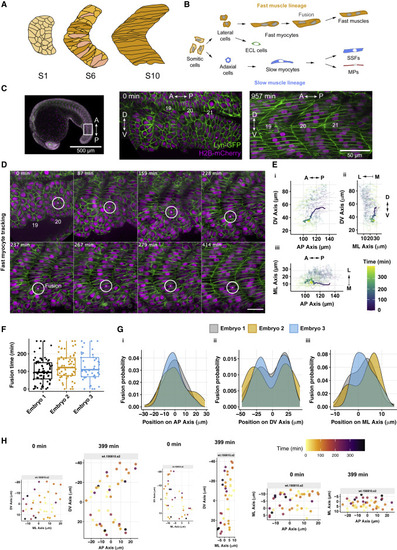
Figure 1. In toto quantification of cell migration and fusion events during myotome formation (A) Schematic of zebrafish myotome development in the AP-DV plane, from immediately after somite segmentation from the PSM to formation of the initial myotome segment. Color coding highlights cell elongation. (B) Schematic of muscle fiber differentiation. Slow fibers remain mono-nucleated and have two subpopulations: muscle pioneers (MPs, red) and superficial slow fibers (SSFs, blue). The lateral cells differentiate mainly into the future fast fibers (orange), which become multinucleated during development, and a smaller subset that forms the external cell layer (ECL). (C) Left: view of a 19-somite stage embryo. (Middle) Somites 19–21, just after the segmentation of somite 21 from the PSM (defined as t = 0). Right: somites 19–21 16 h later. (D) Example of fast myocyte tracking. The position in the ML axis is altered to maintain the center of the nucleus in the plane shown. Scale bar, 50 μm. (E) Tracks of fast myocytes in a complete myotome segment (orthogonal views), with the myocyte from (D) highlighted with thicker lines. Color coding represents the time from segmentation. Positions defined by the spatial coordinates from the (movement corrected) movie. (F) Timing of fusion events. Time t = 0 corresponds to the first fusion event for each segment. Box represents 95% confidence interval (CI), with the bar indicating the median. (G) Spatial distribution of fusion events in (Gi) AP, (Gii) DV, and (Giii) ML axis. Position 0 μm in each axis corresponds to the segment center. (F and G) Data from 9 segments from 3 embryos. (H) Position of cells immediately after segmentation from the PSM (t = 0 min) and 400 min later for a representative segment. Color coding represents the time of individual fusion events. Positions defined as in (G). |
Reprinted from Developmental Cell, 57(17), Mendieta-Serrano, M.A., Dhar, S., Ng, B.H., Narayanan, R., Lee, J.J.Y., Ong, H.T., Toh, P.J.Y., Röllin, A., Roy, S., Saunders, T.E., Slow muscles guide fast myocyte fusion to ensure robust myotome formation despite the high spatiotemporal stochasticity of fusion events, 2095-2110.e5, Copyright (2022) with permission from Elsevier. Full text @ Dev. Cell