
Fig. 6
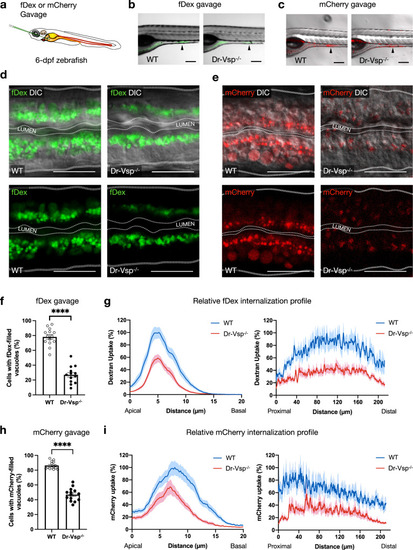
Functional analysis of Dr-Vsp in larval enterocytes.
a Experimental approach: 6-dpf zebrafish larvae were gavaged with Alexa FluorTM 488-tagged dextran (fDex) or mCherry solutions into the anterior intestinal bulb. Live imaging was performed at 2 h after gavage. b–e fDex and mCherry internalized into zebrafish LREs after gavage. b Live confocal images of wild-type (WT) and Dr-Vsp−/− zebrafish larvae showing fDex internalization in enterocytes at the posterior portion of mid-intestine (arrowhead). Scale bar = 200 µm. c Live confocal images of wild-type and Dr-Vsp−/− zebrafish larvae showing mCherry internalization in enterocytes at the posterior portion of mid-intestine (arrowhead). Scale bar = 200 µm. d Live confocal images of wild-type and Dr-Vsp−/− enterocytes showing fDex internalization. The images were presented with DIC (top) or without DIC (bottom) to enhance the visibility of the internalized fDex. Dotted lines conceptually indicate the outlines of larval intestines. Scale bar = 20 µm. e Live confocal images of wild-type and Dr-Vsp−/− enterocytes showing mCherry internalization. The images were presented with DIC (top) or without DIC (bottom) to enhance the visibility of the internalized mCherry. Dotted lines conceptually indicate the outlines of larval intestines. Scale bar = 20 µm. f, g Endocytosis efficiency analysis in LREs after fDex gavage. f Percentage of the enterocytes containing fDex-filled vacuoles at 2 h following gavage, representing the proportion of cells capable of internalizing fDex and forming subsequent endosomal vacuoles. Error bars, means ± SEM; ****P < 0.0001; unpaired Student’s t-test. Number of enterocytes = 344 cells from 14 wild-type and 359 cells from 13 Dr-Vsp−/− zebrafish. g Relative fDex internalization profile comparing between wild-type and Dr-Vsp−/− zebrafish larvae at 2 h following gavage. Data were means ± SEM percentage of intracellular fDex intensity along the specified axes, with 100% indicating the maximal value of the average intensity on each axis. (Left) Apicobasal axis of individual cells. (Right) Longitudinal axis along the posterior portion of mid-intestine. Number of fish = 14 for wild-type and 13 for Dr-Vsp−/−. Data were presented as mean ± SEM, collected from four independent experiments for both wild-type and Dr-Vsp−/−. h, i Endocytosis efficiency analysis in LREs after mCherry gavage. h Percentage of the enterocytes containing mCherry-filled vacuoles at 2 h following gavage, representing the proportion of cells capable of internalizing mCherry and forming large endosomal vacuoles. Error bars, means ± SEM; ****P < 0.0001; unpaired Student’s t-test. The number of enterocytes = 376 cells from 14 wild-type and 341 cells from 14 Dr-Vsp−/− zebrafish. i Relative mCherry internalization profile comparing between wild-type and Dr-Vsp−/− zebrafish larvae at 2 h following gavage. Data were means ± SEM percentage of intracellular mCherry intensity along the specified axes, with a 100% indicates the maximal value of the average intensity on each axis. (Left) Apicobasal axis of individual cells. (Right) Longitudinal axis along the posterior portion of mid-intestine. Number of fish = 14 for each zebrafish line. Data were presented as mean ± SEM, collected from four independent experiments for both wild-type and Dr-Vsp−/−. |
| Fish: | |
|---|---|
| Observed In: | |
| Stage: | Day 6 |