
Fig. 2
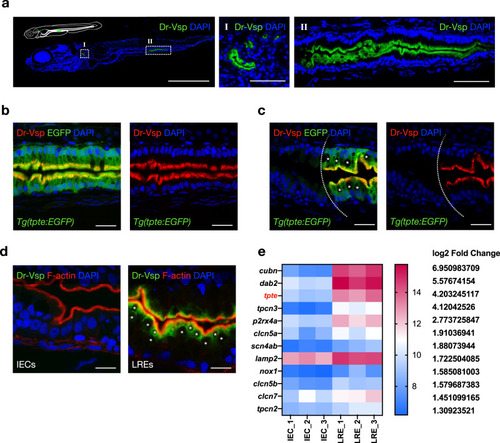
Expression profile of Dr-Vsp protein in zebrafish tissues.
a Confocal images of Dr-Vsp immunostaining in a 7-dpf wild-type zebrafish larva (sagittal section). Dr-Vsp is highly expressed in (I) larval pronephros and (II) enterocytes at the posterior part of the mid-intestine, which are defined as lysosome-rich enterocytes (LREs). Green, Dr-Vsp. Blue, DAPI. Scale bar = 500 µm (left) and 50 µm (middle and right). b Dr-Vsp immunostaining in LREs of a 7-dpf Tg(tpte:EGFP) transgenic zebrafish larva (sagittal section). Dr-Vsp expression signals were completely colocalized with EGFP signals in LREs. Green, Dr-Vsp (tpte:EGFP). Red, Dr-Vsp (antibody). Blue, DAPI. Scale bar = 20 µm. c Dr-Vsp immunostaining in a 7-dpf Tg(tpte:EGFP) transgenic zebrafish larva (sagittal section), showing a border between intestinal epithelial cells (IECs; Vsp-negative) and LREs (Vsp-positive). LREs contain large supranuclear vacuoles in the cytoplasm, contrasting with IECs. Green, Dr-Vsp (tpte:EGFP). Red, Dr-Vsp (antibody). Blue, DAPI. Scale bar = 20 µm. The background signal of the EGFP channel was increased in the left figure to enhance the visibility of IECs. d Dr-Vsp immunostaining in IECs (left) and LREs (right) of a 7-dpf wild-type zebrafish larva (sagittal section). Dr-Vsp expression was restricted mainly to LREs, but not detectable in other IECs. Green, Dr-Vsp. Red, F-actin. Blue, DAPI. Scale bar = 10 µm. Images were visualized under an LSM880 confocal microscope with AiryScan. e Heatmap of RNA-seq data representing expression levels of selected genes in IECs and LREs. Raw data of RNA-seq experiments were retrieved from the GEO Datasets database with accession number {"type":"entrez-geo","attrs":{"text":"GSE124970","term_id":"124970"}}GSE124970 contributed by ref. 23 and analyzed using the web-based application iDEP v0.9269. |
| Genes: | |
|---|---|
| Antibody: | |
| Fish: | |
| Anatomical Terms: | |
| Stage: | Days 7-13 |