
Figure 3
- ID
- ZDB-FIG-220912-41
- Publication
- Routledge et al., 2022 - The scaffolding protein Flot2 promotes cytoneme-based transport of Wnt3 in gastric cancer
- Other Figures
- All Figure Page
- Back to All Figure Page
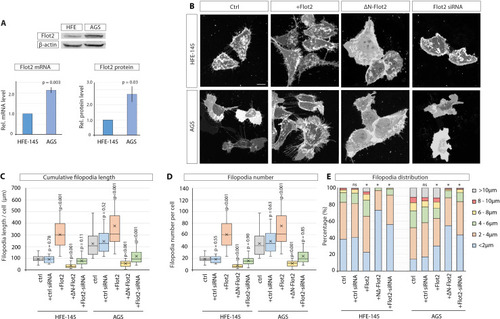
(A) Flot2 protein levels in HFE-145 and AGS cells as quantified by Western blot after normalising to beta-actin levels (n=3) and by RT-qPCR after normalising to Glyceraldehyde-3-Phosphate Dehydrogenase (GAPDH) as a housekeeping gene (n=4). Relative protein and mRNA levels are compared to HFE-145. Error bars represent SEM. Significance is calculated by Student’s t-test. (B) Representative images of HFE and AGS cells expressing membrane-mCherry and indicated Flotillin-2 (Flot2) constructs or siRNA after 48 hr. Scale bars 10 µm. (C–D) Filopodia quantifications of HFE and AGS cells transfected with indicated Flot2 plasmids or siRNA. Significance calculated by Student’s t-test with Bonferroni correction for multiple comparisons. Average cumulative filopodia length (C), average filopodia number per cell (D). (n per condition [HFE]=22, 19, 25, 23, 24). (n per condition [AGS]=25, 21, 25, 25, 25; n=number of cells measured). (E) Distribution of filopodia, categorised by length as a percentage of total filopodia per HFE or AGS cell 48 hr post-transfection with indicated Flot2 plasmids or siRNA. A Pearson’s χ2 test was performed to test for significance between control (ctrl) group (expected) and experimental groups (observed) with 5 degrees of freedom (df) and a p-value <0.05. The specific χ2 values are as follows, HFE: ctrl siRNA 0.86, Flot2 0.001, dnFlot2 <0.001, Flot2 siRNA <0.001, and for AGS: ctrl siRNA 0.65, Flot2 0.007, dnFlot2 <0.001, and Flot2 siRNA <0.001. Asterisks mark significant differences.
|