
Figure 1
- ID
- ZDB-FIG-220912-38
- Publication
- Routledge et al., 2022 - The scaffolding protein Flot2 promotes cytoneme-based transport of Wnt3 in gastric cancer
- Other Figures
- All Figure Page
- Back to All Figure Page
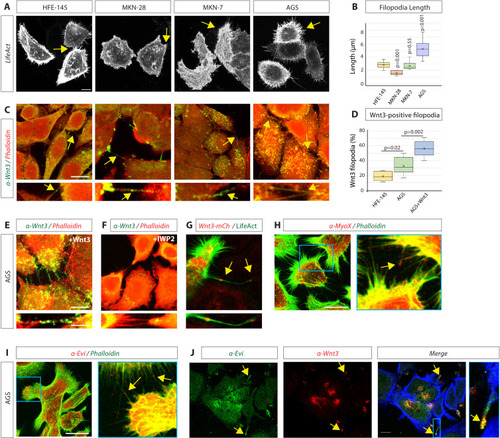
(A) Confocal images of normal gastric epithelial cell line (HFE-145) and gastric cancer (GC) cell lines (MKN-28, MKN-7, and AGS) expressing LifeAct-GFP to visualise actin-based structures. Yellow arrows indicate examples of filopodia. (B) Quantification of filopodia length in GC cell lines MKN-28, MKN-7, and AGS (n=7, 8, 25; n=number of cells). Significance is calculated by Student’s t-test. (C) Immunofluorescent images of HFE, MKN-28, MKN-7, and AGS, stained with antibodies against Wnt3 (green) and actin (Phalloidin-iFluor594, red). Scale bar 10 µm. High-magnification images indicate an example of a Wnt3-bearing cytonemes. Scale bar 2.5 µm. (D) Quantification of Wnt3-positive filopodia in gastric epithelial (HFE-145) and cancer (AGS) cells as a percentage of total filopodia (number of cells analysed = 6, 8, 6). Significance is calculated by Student’s t-test. (E) Immunohistochemistry (IHC) images of AGS cells overexpressing Wnt3 and stained with an antibody against Wnt3 (green) and actin (iFluor594, red). Scale bar 10µm. High-magnification images highlight cytonemes. Scale bar 2.5 µm. (F) IHC images of AGS cells treated with the Porcupine inhibitor IWP2 (100 µM, 48 hr) and stained with an antibody against Wnt3 (green) and actin (iFluor594, red). (G) Live confocal cell imaging of AGS cells expressing Wnt3-mCherry and LifeAct-GFP. Cytoneme-localised Wnt3-mCherry highlighted by yellow arrows. (H–J) IHC images of AGS cells stained with antibodies against (H) Myosin-X (MyoX) and (I) Evi/Wntless (red) and Wnt3 (red) and (J) Evi/Wntless (green Scale bars 10 µm). Phalloidin labels actin (FITC-Phalloidin, green; Phalloidin-iFluor350, blue).
|