
FIGURE
Fig. 6
Fig. 6
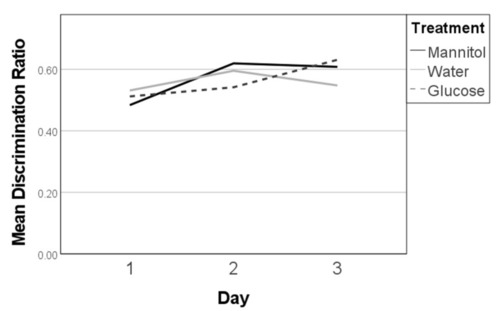
Discrimination ratios in the 8-week washout experiments. Discrimination ratios were calculated on all three 8-week reversal days (day 1, day 2, day 3). In this experiment, fish were exposed to hyperglycemic conditions for 4 weeks, followed by 4 weeks in normglycemic (system water) conditions. No significant differences in discrimination ratios were observed on any reversal day (p > 0.05; one-way ANOVA). Subsequent trendline analysis also failed to identify any significant differences. |
Expression Data
Expression Detail
Antibody Labeling
Phenotype Data
Phenotype Detail
Acknowledgments
This image is the copyrighted work of the attributed author or publisher, and
ZFIN has permission only to display this image to its users.
Additional permissions should be obtained from the applicable author or publisher of the image.
Full text @ Int. J. Mol. Sci.