
Fig. 4
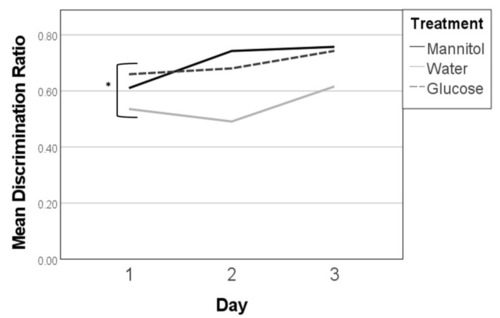
Discrimination ratios after 12 weeks of prolonged hyperglycemia. Discrimination ratios were calculated on all three 12-week reversal days (day 1, day 2, day 3) for responses of fish in each treatment group. A significant difference due to treatment was noted on day 1 only (one-way ANOVA, F (2,138) = 4.904, p = 0.009 *), wherein responses from glucose- and mannitol-treated fish were larger than water-treated controls. Subsequent trendline analysis did not identify any significant trends in responses across all three days of the shoal reward. A significant trend line was not found for glucose-treated fish (dashed line). |