
Fig. 3
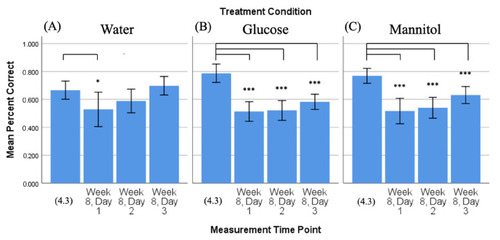
Comparison of 4-week vs. 8-week reversal. Mean percent correct scores (+/−95% CI) calculated on 4-week reversal day 3 (4.3) were compared to scores calculated on all three 8-week reversal days for (A) water-treated, (B) glucose-treated, and (C) mannitol-treated fish using individual t-tests. Water-treated fish showed an improvement in scores over the three 8-week reversal days, indicating they were able to learn the new location of the shoal reward. In contrast, glucose- and mannitol-treated fish had significantly lower numbers of correct scores on all three 8-week reversal days (day 1 p < 0.001, day 2 p < 0.001, day 3 p ≤ 0.001), suggesting these fish were unable to learn the new location of the shoal reward. * and ***: Asterisks denote significant differences. |