
Fig. 6
- ID
- ZDB-FIG-220905-29
- Publication
- Kowatschew et al., 2022 - Spatial organization of olfactory receptor gene choice in the complete V1R-related ORA family of zebrafish
- Other Figures
- All Figure Page
- Back to All Figure Page
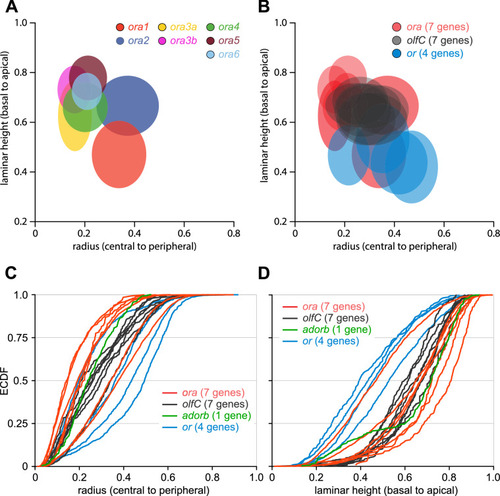
Multidimensional analysis of spatial expression patterns shows significantly different expression zones for all ora genes and clear segregation from two other olfactory receptor families. (A) Comparison of spatial distribution parameters between ora genes. Schematic representation of spatial distributions for all ora genes by ellipses ranging from the 1st to the 3rd quartile value for radial (x axis) and laminar height (y axis) parameter. Color code for ora genes as before. (B) Comparison of distributions for ora versus olfC and odorant receptor (or) genes using the same coordinates and representation as in (A). Note that the color code is changed compared to panel (A). The raw data for olfC genes are taken from11, raw data for the radial parameter of or genes are from7. For names and quartile values of or and olfC genes see SI Table 1. (C,D) Distributions of ora-expressing OSNs intercalate between those of other olfactory receptor families. Distributions are shown as ECDFs. Red lines, ora genes; black, olfC genes; blue, or genes. Panel (C) shows the distribution for the radial coordinate, panel (D) depicts the laminar height parameter. |