
Fig. 1
- ID
- ZDB-FIG-220905-24
- Publication
- Kowatschew et al., 2022 - Spatial organization of olfactory receptor gene choice in the complete V1R-related ORA family of zebrafish
- Other Figures
- All Figure Page
- Back to All Figure Page
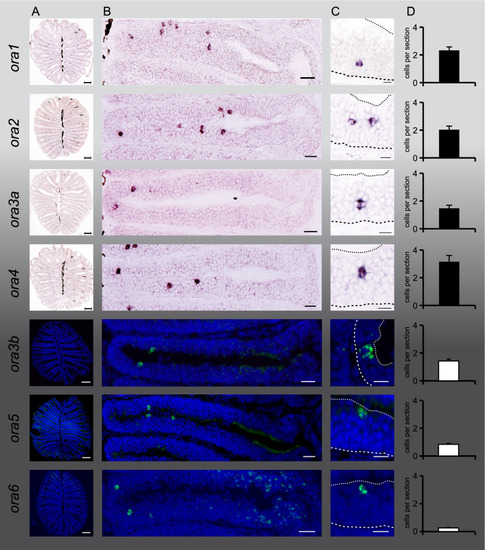
Expression of all seven ora genes in sparsely distributed cells in the olfactory epithelium. Horizontal sections of adult zebrafish olfactory epithelia were hybridized with probes for all seven ora genes, as indicated. Chromogenic detection by NBT/BCIP for ora1, ora2, ora3a and ora4, fluorigenic detection with TSA for ora3b, ora5, and ora6. Column (A) shows representative complete sections labeled with the respective probes. Column (B), higher magnifications of a single lamella from different sections. All panels have the same orientation, center (median raphe) to the left and periphery to the right. Note that for better visualization sections with above average frequency were selected, thus values are higher than the average values shown in column (D). Column (C), higher magnification shows positions of single cells within the lamella. Coarse dashed lines depict the border to the basal lamina and fine dashed lines depict the apical border to the lumen, cf. Fig. 2. (A) Scale bars correspond to 100 µm, (B) scale bars 20 µm (30 µm for ORA1), (C) scale bars 10 μm. Column (D), bar graphs show number of labeled cells per section for each ora gene (mean +/− SEM, for number of sections analysed see SI Fig. 1). |
| Genes: | |
|---|---|
| Fish: | |
| Anatomical Term: | |
| Stage: | Adult |