
FIGURE
Fig. 3
- ID
- ZDB-FIG-220829-213
- Publication
- Quelle-Regaldie et al., 2022 - A nop56 Zebrafish Loss-of-Function Model Exhibits a Severe Neurodegenerative Phenotype
- Other Figures
- All Figure Page
- Back to All Figure Page
Fig. 3
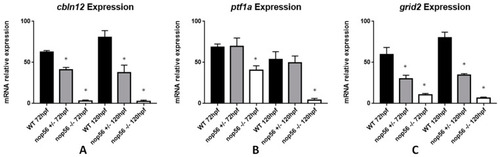
Graphic representation of expression analysis by RT-qPCR. (A) Cbln12 expression is significantly reduced in nop56+/− and nop56−/− embryos between at 72 and 120 hpf in comparison with wild-type embryos (p-value < 0.0001). (B) Ptf1a expression is significantly reduced in nop56−/− embryos at 72 and 120 hpf (p-value < 0.0001.) (C) Grid2 expression is significantly reduced in nop56+/− and nop56−/− embryos between at 72 and 120 hpf in comparison with wild-type embryos (p-value < 0.0001). Statistically significant data in the graphs is indicated with a *. |
Expression Data
| Genes: | |
|---|---|
| Fish: | |
| Anatomical Term: | |
| Stage Range: | Protruding-mouth to Day 5 |
Expression Detail
Antibody Labeling
Phenotype Data
| Fish: | |
|---|---|
| Observed In: | |
| Stage Range: | Protruding-mouth to Day 5 |
Phenotype Detail
Acknowledgments
This image is the copyrighted work of the attributed author or publisher, and
ZFIN has permission only to display this image to its users.
Additional permissions should be obtained from the applicable author or publisher of the image.
Full text @ Biomedicines