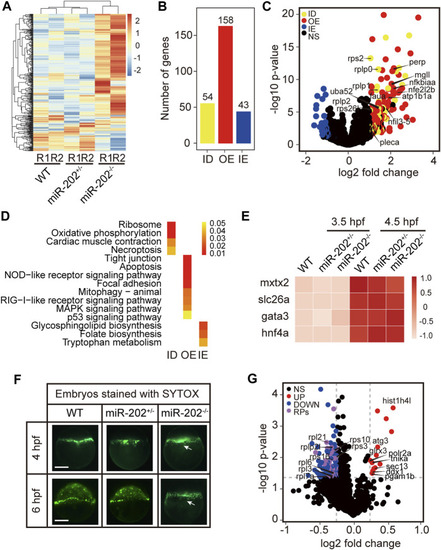
Transcriptomic and proteomic analysis for miR-202 mutant embryos. (A) Heat map showing distinctive gene expression patterns of miR-202−/−, miR-202+/- and WT embryos at 3.5 hpf. R1 and R2 indicate sampling replicates. (B) The number of differentially expressed genes in three subgroups: ID, insufficient degradation; OE, over-expression; IE, insufficient expression. (C) Volcano plot of differentially expressed genes between homozygous and heterozygous miR-202 embryos. (D) KEGGs enriched in the three subgroups of differentially expressed genes. (E) Expression of genes related to the initiation and subcapsulation of Yolk Syncytial Layer (YSL) at 3.5 and 4.5 hpf in wild type and miR-202+/- and miR-202−/− indicating normal expression. (F) Verification that the loss of the miR-202 locus cannot affect the formation of YSL at 4 hpf, but miR-202−/− embryos cannot successfully achieve epibolic movement compared with wild type and miR-202+/- embryos. The white arrow represents YSL. The scale bar is 200 µm. (G) Distribution of differentially expressed proteins in miR-202−/− embryos. NS, no significant difference; UP, up-regulated; DOWN, down-regulated; RPs, ribosome-associated proteins.
|
