FIGURE SUMMARY
Title

MiR-202-3p determines embryo viability during mid-blastula transition

Authors
Hu, R., Xu, Y., Han, B., Chen, Y., Li, W., Guan, G., Hu, P., Zhou, Y., Xu, Q., Chen, L.
Source
Full text @ Front Cell Dev Biol

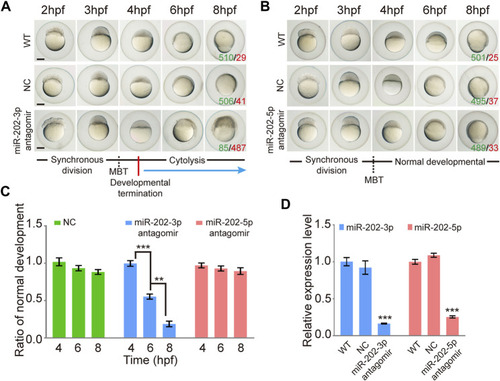
Inhibition of miR-202-3p by an antagomir results in termination of embryonic development at MBT in zebrafish. (A) Time-matched bright field images of embryos showing developmental termination at 4 hpf and, finally, cytolysis after miR-202-3p antagomir (8 µM) injection in the fertilized embryos compared with embryos of wild type and NC embryos injected with scrambled miR-202-3p antagomir (8 µM). The green number indicates the number of embryos with normal development and in red the number indicates the abnormal development. WT embryos at 8hpf were used as phenotypic control. (B) Time-matched bright field images of embryos showing completely normal development of zebrafish embryos injected with miR-202-5p antagomir (8 µM); patterns are similar with what is found for wild type (WT) and NC (scrambled antagomir) injection embryos over the same developmental time course. The green number indicates the number of embryos with normal development and in red the number indicates the abnormal development. WT embryos at 8hpf were used as phenotypic control. (C) The statistics of embryo viability at 4 hpf, 6 hpf and 8 hpf following injection with miR-202-3p antagomir, miR-202-5p antagomir or NC (scrambled antagomir). (D) qRT-PCR analyses showing embryonic content of miR-202-3p and miR-202-5p after treatment with respective antagomirs. The scale bar is 100 µm. Error bars, mean ± s.d., n = 3 (biological replicates).

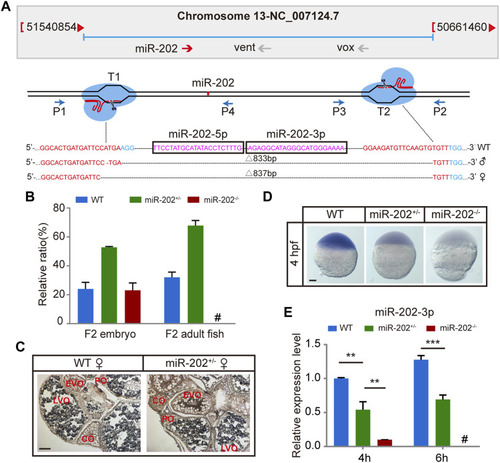
Deletion of miR-202 from the zebrafish genome using CRISPR-Cas9 system. (A) Schematic illustration of CRISPR/Cas9 system used to produce the knock-out lines of miR-202. The miR-202 sequences are in magenta, miR-202-3p and miR-202-5p are marked with a rectangular frame; the sgRNA target sites are in red; the PAM motif (NGG) is shown in blue. The location and direction of primers (P1-P4) used for PCR screening are also shown with arrow. (B) Genotyping of miR-202 mutant F2 embryos at 4hpf and F2 adults (3 month). (C)In situ hybridization of ovaries from miR-202 wild type (WT) and heterozygotes (miR-202+/-) to examine expression of miR-202-3p. The developmental stages of ovarian oocytes include the primary oocytes: perinuclear oocytes (PO) and cortical alveolar oocytes (CO); the mature oocytes: early vitellogenin oocytes (EVO) and late vitellogenin oocytes (LVO). The scale bar is 10 µm. (D) Whole mount in situ hybridization showing expression of miR-202-3p in wild type (WT), heterozygous (miR-202+/-) and homozygous (miR-202−/−) embryos at 4 hpf. The scale bar is 100 µm. (E) qRT-PCR analysis of miR-202-3p expression in wild type, heterozygous and homozygous embryos at 4 hpf and 6 hpf. Error bars, mean ± s.d., n = 3 (biological replicates).

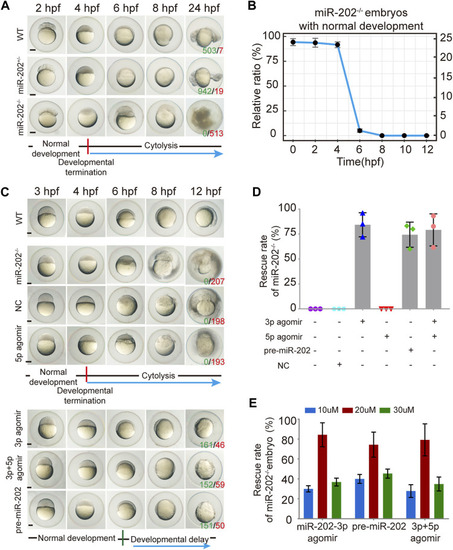
Deletion of the miR-202 locus recapitulated the phenotype of miR-202-3p knockdown. (A) Time-matched bright field images showing developmental termination of homozygous (miR-202−/−) embryos at 4 hpf in contrast with normal development of heterozygous (miR-202+/-) and wild type (WT) embryos. The green number indicates the number of embryo with normal development and in red the number indicates the abnormal development. WT embryos at 24 hpf were used as phenotypic control. (B) The survival rate curve for miR-202−/− embryos from 0 to 12 hpf. (C) Time-matched bright field images of miR-202−/− embryos when rescued by various reagents. The green number indicates the number of embryo that has been rescued and in red the number indicates the unsalvaged. 3p agomir embryos at 12 hpf were used as the control of successful rescue phenotype. (D) Rescue rates of miR-202−/− homozygotes by miR-202-3p agomir, miR-202-5p agomir, pre-miR-202 and a combination of miR-202-3p and miR-202-5p agomirs measured at 12 hpf. (E) The rescue rates of miR-202−/− embryos obtained with three different concentrations (10 μM, 20 and 30 µM) of rescue reagents measured at 12 hpf, indicating an optimal rescuing concentration for each reagent. The scale bar is 200 µm. Error bars, mean ± s.d., n = 3 (biological replicates).

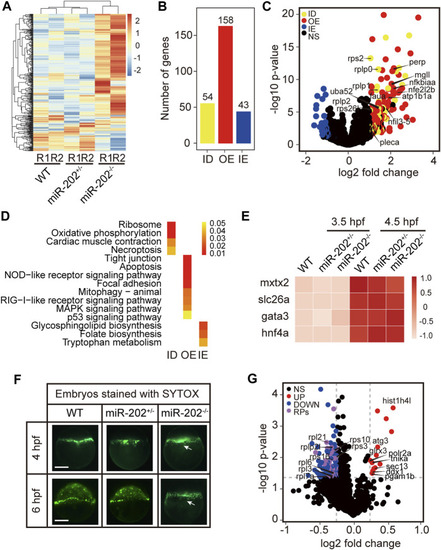
Transcriptomic and proteomic analysis for miR-202 mutant embryos. (A) Heat map showing distinctive gene expression patterns of miR-202−/−, miR-202+/- and WT embryos at 3.5 hpf. R1 and R2 indicate sampling replicates. (B) The number of differentially expressed genes in three subgroups: ID, insufficient degradation; OE, over-expression; IE, insufficient expression. (C) Volcano plot of differentially expressed genes between homozygous and heterozygous miR-202 embryos. (D) KEGGs enriched in the three subgroups of differentially expressed genes. (E) Expression of genes related to the initiation and subcapsulation of Yolk Syncytial Layer (YSL) at 3.5 and 4.5 hpf in wild type and miR-202+/- and miR-202−/− indicating normal expression. (F) Verification that the loss of the miR-202 locus cannot affect the formation of YSL at 4 hpf, but miR-202−/− embryos cannot successfully achieve epibolic movement compared with wild type and miR-202+/- embryos. The white arrow represents YSL. The scale bar is 200 µm. (G) Distribution of differentially expressed proteins in miR-202−/− embryos. NS, no significant difference; UP, up-regulated; DOWN, down-regulated; RPs, ribosome-associated proteins.

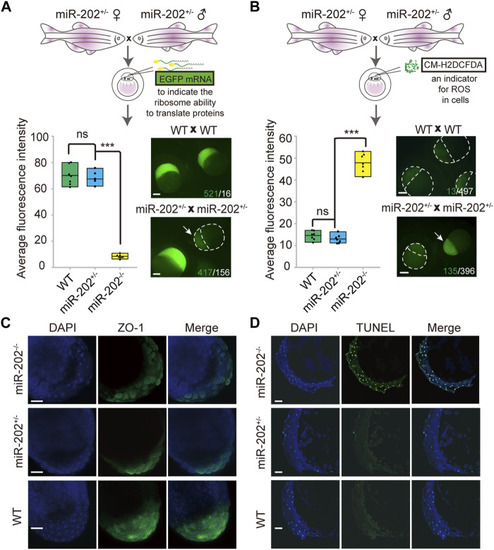
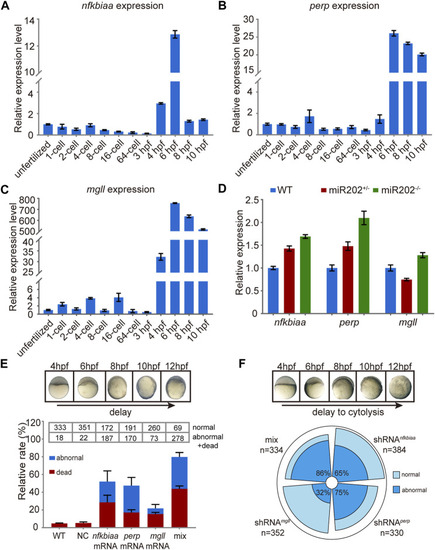
Homeostatic disorders in miR-202−/− embryos. (A) Illustrations showing assessment of translation efficiency using polyadenylated EGFP mRNA. Embryos derived from miR-202 heterozygous parents were used for assessment. Drastically reduced fluorescence intensity (bottom left panel) and images (bottom right panel) were obtained from the miR-202−/− embryos at 3.5 hpf. The embryo pointed to by white arrows was a miR-202−/− embryo, as verified through genotyping. The scale bar is 200 µm. The green number indicates the number of embryos successfully expressing EGFP, and in white the number indicates the number of embryos that unexpressed or low expressed EGFP. (B) Illustrations showing assessment of reactive oxygen species using CM-H2DCFDA. Embryos derived from miR-202 heterozygous parents were used for assessment. Elevated fluorescence intensity (bottom left panel) and images (bottom right panel) were obtained in the miR-202−/− embryos at 3.5 hpf. The embryo indicated by the white arrow was a miR-202−/− embryo, as verified through genotyping. The green number indicates the number of embryos that produce high level of ROS, and in white the number indicates the number of embryos with low ROS levels. The scale bar is 200 µm. (C) Immunohistochemical detection of zonula occludens-1 (ZO-1) in wild type and miR-202 mutant embryos at 3.5 hpf. The scale bar is 100 µm. (D) TUNEL staining for apoptotic signals in the wild type and miR-202 mutant embryos at 3.5 hpf. The scale bar is 100 µm. Error bars, mean ± s.d., n = 3 (biological replicates).

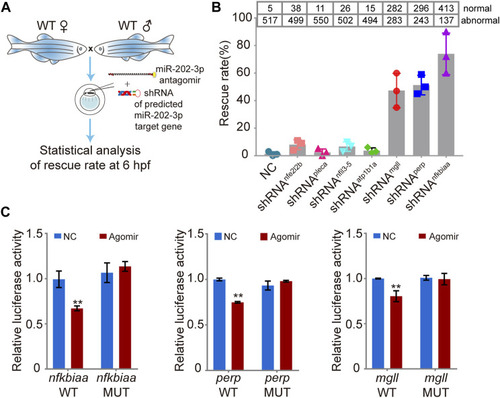
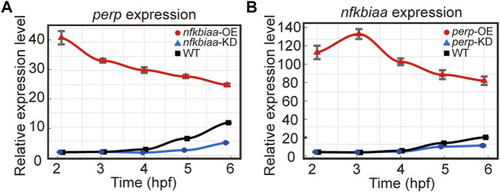
Validation of the function of the miR-202-3p target genes in embryogenesis. (A) Schematic illustration of rescue using shRNAs specific to the miR-202-3p target genes. Briefly, survival rates at 6 hpf were measured for wild type embryos co-injected with miR-202-3p antagomir (8 µM) and the specific shRNA (200 ng/ul) to one of the target genes at the 1-cell stage. (B) Rescue rates at 6 hpf for various shRNAs tested. More than 500 embryos were detected for each shRNA. (C) Validation of the existence of miR-202-3p binding sites in the 3′UTRs of nfkbiaa, perp and mgll genes by dual luciferase assays in HEK29T cells. Luciferase activities from constructs containing the 3′UTRs of wild type (WT) or mutated miR-202-3p binding site (MUT) for each gene were measured comparatively. NC, scrambled miR-202-3p; Agomir, synthetic miR-202-3p. Error bars, mean ± s.d., n = 3 (biological replicates).

In vivo validation of the involvement of nfkbiaa, perp and mgll in zebrafish early development. (A–C) qRT-PCR analysis of nfkbiaa(A), perp(B) and mgll(C) expression during the course of early embryonic development from unfertilized embryo to 10 hpf. (D) Quantitative analysis of homozygous, heterozygous and wild-type embryos revealed that the expression level of nfkbiaa, perp and mgll was overexpressed in miR-202 homozygous mutant. (E) Time-matched bright field images of slow-developing embryos (top) and the rate of mortality and developmental abnormality (bottom) when extra mRNA of nfkbiaa, perp and mgll were introduced to wild type embryos (bottom). The “mix” indicates mixture of equal amounts of mRNAs of the three genes. The statistical assays were performed using data obtained at 12 hpf. (F) Time-matched bright field images of embryo showing developmental delay and cytolysis (top) and the rate of developmental abnormality (bottom) when shRNA of nfkbiaa, perp and mgll were introduced to wild type embryos. The “mix” indicates mixture of equal amount of shRNAs of the three genes. Error bars, mean ± s.d., n = 3 (biological replicates).

nfkbiaa and perp are inter-regulated in early embryonic development. (A) The mRNA expression level of perp response to overexpression (by mRNA microinjection) and downregulation (by shRNA microinjection) of nfkbiaa in zebrafish embryos observed from 2 hpf to 6 hpf. (B) The mRNA expression level of nfkbiaa response to overexpression (by mRNA microinjection) and downregulation (by shRNA microinjection) of perp in zebrafish embryos observed from 2 hpf to 6 hpf. Error bars, mean ± s.d., n = 3 (biological replicates).

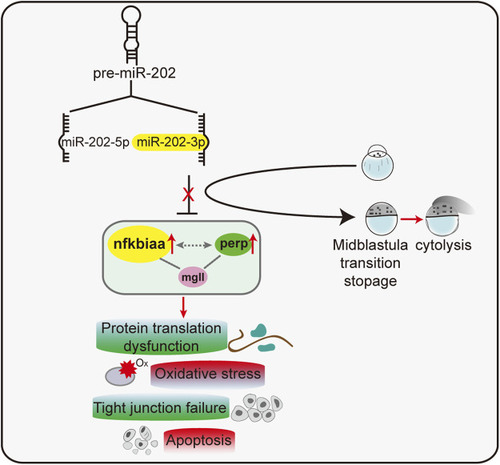
A proposed model of a miR-202-3p mediated regulatory network that determines embryonic viability during MBT in zebrafish.

Acknowledgments
This image is the copyrighted work of the attributed author or publisher, and ZFIN has permission only to display this image to its users. Additional permissions should be obtained from the applicable author or publisher of the image. Full text @ Front Cell Dev Biol