
Fig. 1
- ID
- ZDB-FIG-220817-19
- Publication
- Adant et al., 2022 - Pyruvate and uridine rescue the metabolic profile of OXPHOS dysfunction
- Other Figures
- All Figure Page
- Back to All Figure Page
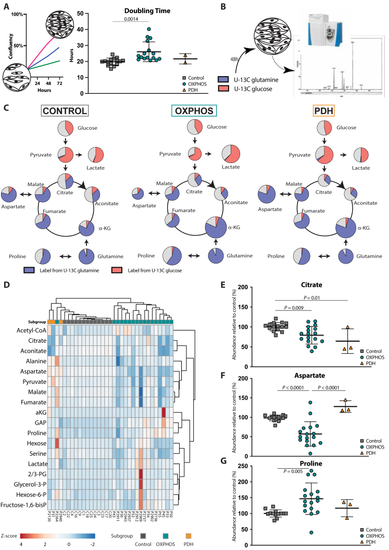
Metabolic profile of mitochondrial disease A Design of the fibroblast proliferation assays based on 72-hours IncucyteⓇ proliferation experiments. Doubling time was calculated over a 48-hour period starting 24 h after plating (control (n = 15), OXPHOS deficient (n = 17) and PDH deficient (n = 3) fibroblast cell lines; technical replicates >3 per cell line). B Design of the tracer-based metabolomics studies with cultures with U–13C glucose or U–13C glutamine. C A simplified map of glycolysis and TCA cycle is depicted. The area of the circles represents the relative abundance of the metabolite compared to average control. Pink, blue and grey colour represent the fractional labelling coming from U–13C glucose, U–13C glutamine or other sources, respectively. D Heatmap displaying the changes in metabolite relative abundances of glycolysis, TCA and linked amino acids relative to controls in the different fibroblast cell lines. The colour scale (blue to red) corresponds to the z-score value of the relative abundance of the metabolite. Grouping of the different cell lines into disease subgroups is annotated with different colours: |
 OXPHOS deficiency;
  PDH deficiency and
  controls. Full description of the genetic deficiency per cell line is described in