
Fig. 2
- ID
- ZDB-FIG-220817-20
- Publication
- Adant et al., 2022 - Pyruvate and uridine rescue the metabolic profile of OXPHOS dysfunction
- Other Figures
- All Figure Page
- Back to All Figure Page
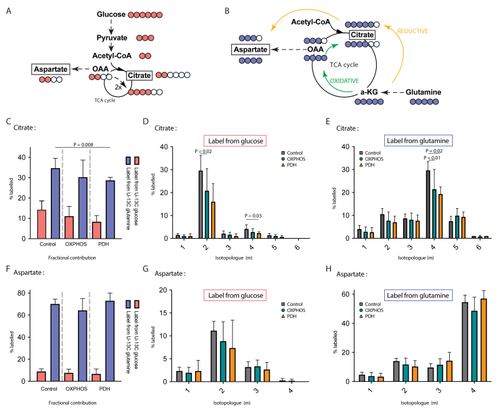
TCA alterations in OXPHOS dysfunction A Schematic representation of anaplerotic glucose flux into the TCA cycle metabolites with cataplerotic efflux and conversion into aspartic acid. The circles represent the number of carbons, with pink filled circles the number of labelled carbons coming from fully labelled U–13C glucose. B Schematic representation of anaplerotic glutamine flux into the TCA cycle metabolites with cataplerotic efflux and conversion into aspartic acid. The circles represent the number of carbons, with blue filled circles the number of labelled carbons coming from fully labelled glutamine. C Fractional carbon labelling data of citrate in control, OXPHOS deficient and PDH deficient fibroblasts cell lines cultured with U–13C glucose or U–13C glutamine. D Comparison of the 6 isotopologues of citrate in control, OXPHOS deficient and PDH deficient fibroblasts cell lines cultured with U–13C glucose or E U–13C glutamine. F Fractional carbon labelling data of aspartate in control, OXPHOS deficient and PDH deficient fibroblasts cell lines cultured with U–13C glucose or U–13C glutamine. G Comparison of the 4 isotopologues of aspartate in control, OXPHOS deficient and PDH deficient fibroblasts cell lines cultured with U–13C glucose or H U–13C glutamine. Tracer metabolomics in control (n = 15), OXPHOS deficient (n = 17) and PDH deficient (n = 3) fibroblast cell lines (technical replicates 1–3 per cell line). Abundances normalized for protein content (BCA) and to the average of the controls per experiment. Statistics: one-way ANOVA with post-hoc Dunnett's T3 multiple comparison tests, and the error bars are +/−SD. a-KG: alpha-ketoglutarate; CoA: coenzyme A; OAA: oxaloacetate; OXPHOS: oxidative phosphorylation system; PDH: pyruvate dehydrogenase; TCA: tricarboxylic acid. |