|
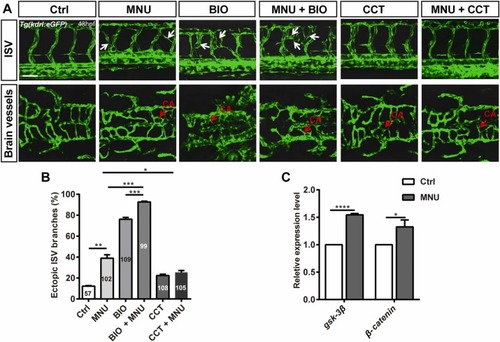
Fig. 5. Wnt/β-catenin signaling mediates MNU-induced abnormal angiogenesis. A. Representative images of ISV and hindbrain vessels from control group, MNU-treated group, BIO-treated group, BIO plus MNU-treated group, CCT-treated group and CCT plus MNU-treated group at 48 hpf. White arrows point to ectopic ISV branches. Red arrows point to the central artery (CA). BIO, (2'Z,3'E)− 6-bromoindirubin-3'-oxime; CCT, CCT036477. Scale bar, 50 µm. B. Quantitative analysis of ectopic intersegmental vessel (ISV) branches in control group, MNU-treated group, BIO-treated group, BIO plus MNU-treated group, CCT-treated group and CCT plus MNU-treated group at 48 hpf. Data were obtained from three independent experiments and are shown as the mean ± SEM. * **P < 0.001, * * P < 0.01, * P < 0.05. C. Quantitative analysis of gsk-3β and β-catenin expression of the control group and MNU-treated group by RT-qPCR. The data are presented as the mean ± SEM. * ** * P < 0.0001, * P < 0.05.
|