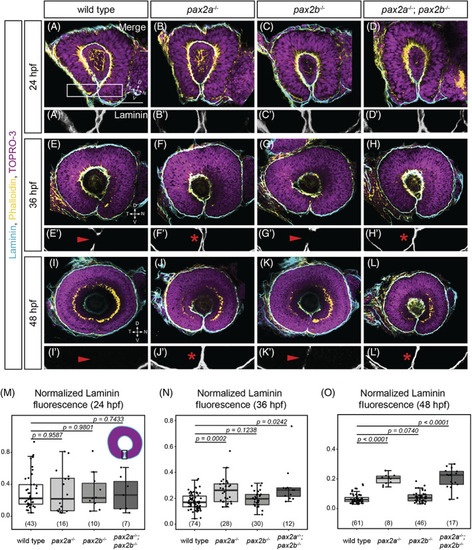
The optic fissure basement membrane fails to break down in pax2a and pax2a; pax2b mutants. Whole‐mount staining for Laminin (cyan), F‐actin (yellow, phalloidin), and nuclei (magenta, TO‐PRO‐3) at 24 hpf (A‐D), 36 hpf (E‐H), and 48 hpf (I‐L). Zoomed views of the optic fissure (A'‐L', from boxed region (as shown in A) show Laminin alone (grayscale). All images are lateral views, single optical sections. (A) Wild‐type, (B) pax2a tu29a , (C) pax2b sa10953 , (D) and pax2a tu29a ; pax2b sa10953 embryos at 24 hpf. (A'‐D′) Zoomed views of Laminin staining alone, showing Laminin staining in the optic fissure in all genotypes. (E) Wild‐type, (F) pax2a tu29a , (G) pax2b sa10953 , and (H) pax2a tu29a ; pax2b sa10953 embryos at 36 hpf. (E', G') Zoomed views of Laminin staining; staining is missing in wild‐type and pax2b sa10953 mutant optic fissures (red arrowheads). (F′, H′) Zoomed views of Laminin staining, which persists and completely lines the optic fissure (red asterisks) in pax2a tu29a and pax2a tu29a ; pax2b sa10953 mutants. (I) Wild‐type, (J) pax2a tu29a , (K) pax2b sa10953 , and (L) pax2a tu29a ; pax2b sa10953 embryos at 48 hpf. (I′, K′) Zoomed views of Laminin staining; staining is largely absent in wild‐type and pax2b sa10953 mutant optic fissures (red arrowheads). (J', L') Zoomed views of Laminin staining, which continues to completely line the optic fissure in pax2a tu29a and pax2a tu29a ; pax2b sa10953 mutants (red asterisk). (M‐O) Quantification of Laminin fluorescence intensity normalized to TO‐PRO‐3 at a single mid‐depth section using an ROI around the optic fissure, 24 hpf (M); 36 hpf (N); and 48 hpf (O). n (embryos) shown at base of graphs. P‐values for (M‐O) were calculated using an unpaired Student's t‐test. Schematic (M) shows the region where the ROI was placed for quantification of the fluorescence intensity. Scale bar: 50 μm
|
