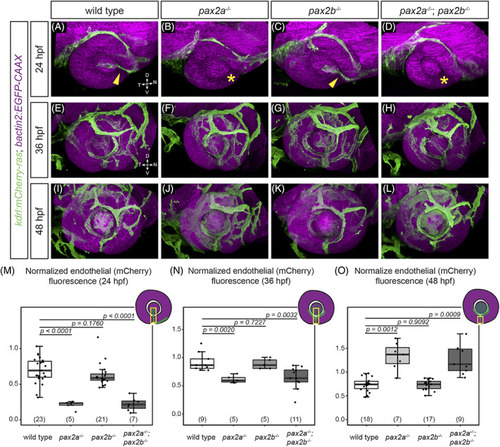
POM‐derived endothelial cells do not properly populate the optic fissure in pax2a and pax2a; pax2b mutants. Embryos visualized for endothelial cells (green; Tg(kdrl:mCherry‐ras)) and cell membranes (magenta; Tg(bactin2:EGFP‐CAAX)) at 24 hpf (A‐D), 36 hpf (E‐H), and 48 hpf (I‐L). All images are lateral views of three‐dimensional renderings. (A) Wild‐type, (B) pax2a tu29a , (C) pax2b sa10953 , (D) and pax2a tu29a ; pax2b sa10953 embryos at 24 hpf. kdrl transgene‐positive cells are located within the fissure (yellow arrowhead) and behind the lens in (A) wild‐type and (C) pax2b sa10953 . kdrl transgene‐positive cells are absent from this region (yellow asterisk) in (B) pax2a tu29a and (D) pax2a tu29a ; pax2b sa10953 mutants. (E) Wild‐type, (F) pax2a tu29a , (G) pax2b sa10953 , (H) and pax2a tu29a ; pax2b sa10953 mutant embryos at 36 hpf. (I) Wild‐type, (J) pax2a tu29a , (K) pax2b sa10953 , (L) and pax2a tu29a ; pax2b sa10953 mutant embryos at 48 hpf. In contrast to 24 hpf, (J) pax2a tu29a and (L) pax2a tu29a ; pax2b sa10953 mutants show increased POM‐derived endothelial cells in the fissure region. (M‐O) Quantification of endothelial cell (mCherry) fluorescence intensity normalized to GFP in a region of a maximum intensity projection of the optic fissure, 24 hpf (M); 36 hpf (N); and 48 hpf (O). n (embryos) shown at base of graphs. P‐values for (M‐O) were calculated using an unpaired Student's t‐test. (M‐O) Schematics show the specific region where the ROI was placed on the projected image for quantification of fluorescence intensity at 24 (M) and 36 hpf (N); the ROI did not include the lens region for quantification of fluorescence intensity at 48 hpf (O)
|
