
Fig. 2
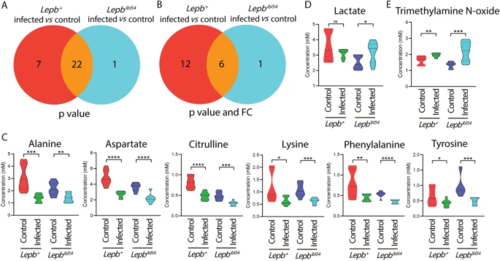
Venn diagrams show the number of metabolites measured by HR-MAS NMR spectroscopy in response to infection in the lepb+ and lepbibl54 zebrafish larvae. A A Venn diagram shows the number of metabolites in response to M. marinum infection in the lepb+ and lepbibl54 larvae with p < 0.05. B A Venn diagram shows the number of metabolites in response to M. marinum infection in the lepb+ and lepbibl54 larvae with p < 0.05 and FC > 1.5 or FC < − 1.5. FC fold change. C Quantification of the common six metabolites in B. ****p < 0.0001. D Quantification of the one metabolite lactate in A. *p < 0.05. ns non-significant. E Quantification of the one metabolite trimethylamine N-oxide in B. **p < 0.01, ***p < 0.001 |
| Fish: | |
|---|---|
| Condition: | |
| Observed In: | |
| Stage: | Day 5 |