FIGURE

Figure 9

ID
ZDB-FIG-220730-33
Publication
Petersen et al., 2022 - Evolution and developmental expression of the sodium-iodide symporter (NIS, slc5a5) gene family: Implications for perchlorate toxicology
Other Figures
All Figure Page
Back to All Figure Page
Figure 9

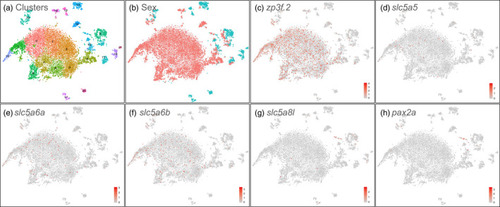
Single‐cell RNA‐seq analysis of 30 dpf zebrafish gonads. (a) tSNE plot with clusters numbered. Each dot represents a cell; (b) Cells from genetically female (red) and male (blue) gonads; (c) zp3f.2 eggshell protein gene expression, darker red indicates higher expression level according to the legend in the corner; (d) slc5a5 expression in maturing oocytes; (e) slc5a6a expression in a few immature ZW germ cells and in many maturing oocytes; (f) slc5a6b expression in a few immature ZW germ cells and in many maturing oocytes; (g) slc5a8l expression primarily in somatic cells of the gonad; and (h) pax2a expression in the same cluster as slc5a8l. The scale bar gives the natural log‐transformed feature counts for each cell divided by the total counts for that cell, multiplied by the scale factor (a value of 1 is added to each count before the calculation to avoid taking the log of 0)

Expression Data

Expression Detail
Antibody Labeling
Phenotype Data

Phenotype Detail
Acknowledgments
This image is the copyrighted work of the attributed author or publisher, and ZFIN has permission only to display this image to its users. Additional permissions should be obtained from the applicable author or publisher of the image. Full text @ Evol. Appl.