|
Figure 9
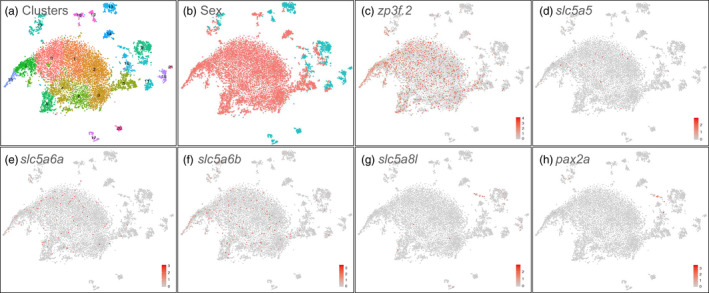
Single‐cell RNA‐seq analysis of 30 dpf zebrafish gonads. (a) tSNE plot with clusters numbered. Each dot represents a cell; (b) Cells from genetically female (red) and male (blue) gonads; (c)

|
|
Figure 9
Single‐cell RNA‐seq analysis of 30 dpf zebrafish gonads. (a) tSNE plot with clusters numbered. Each dot represents a cell; (b) Cells from genetically female (red) and male (blue) gonads; (c)