
FIGURE
Fig. 2
- ID
- ZDB-FIG-220727-8
- Publication
- Liao et al., 2022 - Cell landscape of larval and adult Xenopus laevis at single-cell resolution
- Other Figures
- All Figure Page
- Back to All Figure Page
Fig. 2
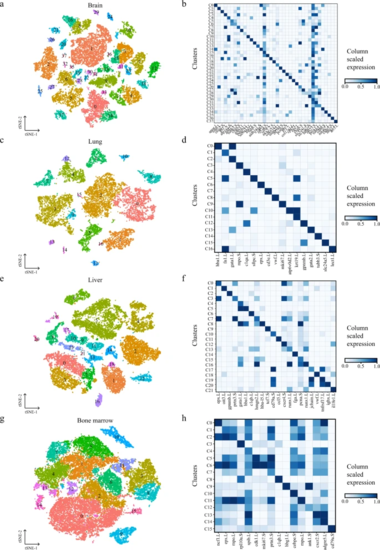
t-SNE map of Xenopus brain (a), lung (c), liver (e), and bone marrow (g) single-cell data. Cells are colored by cell-type cluster; Heatmap showing representative gene expression in each cluster of Xenopus brain (b), lung (d), liver (f), and bone marrow (h). The color encodes the average expression level. |
Expression Data
Expression Detail
Antibody Labeling
Phenotype Data
Phenotype Detail
Acknowledgments
This image is the copyrighted work of the attributed author or publisher, and
ZFIN has permission only to display this image to its users.
Additional permissions should be obtained from the applicable author or publisher of the image.
Full text @ Nat. Commun.