
Fig. 5
- ID
- ZDB-FIG-220727-11
- Publication
- Liao et al., 2022 - Cell landscape of larval and adult Xenopus laevis at single-cell resolution
- Other Figures
- All Figure Page
- Back to All Figure Page
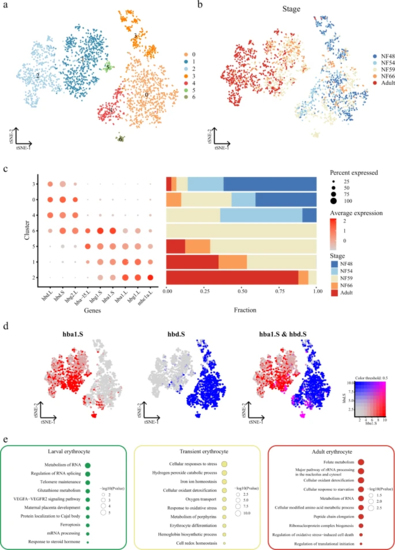
a t-SNE analysis of erythrocytes collected from larval and adult Xenopus. Different clusters are labeled in different colors. Erythrocytes from adults were sampled to the same order of magnitude as in larva. Cell cluster markers are listed in Supplementary Dataset 3. b t-SNE analysis of erythrocytes collected from larval and adult Xenopus. Different stages are labeled in different colors. c Representative gene expression in each cluster of erythrocytes and cell proportions in different stages are shown. Stages are labeled in different colors. The size of the dot encodes the percentage of cells within a cell type, and the color encodes the average expression level. d Feature plot in the t-SNE map of erythrocytes collected from larval and adult Xenopus. Cells are colored according to the expression of the indicated marker genes hba1.S (red), hbd.S (blue), and co-expression hba1.S and hbd.S (pink). e Representative GO terms enriched in each module for three cell types. Different cell clusters are labeled in different colors. P value was calculated by the hypergeometric distribution, a statistical test is one-sided, adjustments P values were made after P value is corrected by Benjamin–Hochberg multiple test. |