
Fig. 4
- ID
- ZDB-FIG-220727-10
- Publication
- Liao et al., 2022 - Cell landscape of larval and adult Xenopus laevis at single-cell resolution
- Other Figures
- All Figure Page
- Back to All Figure Page
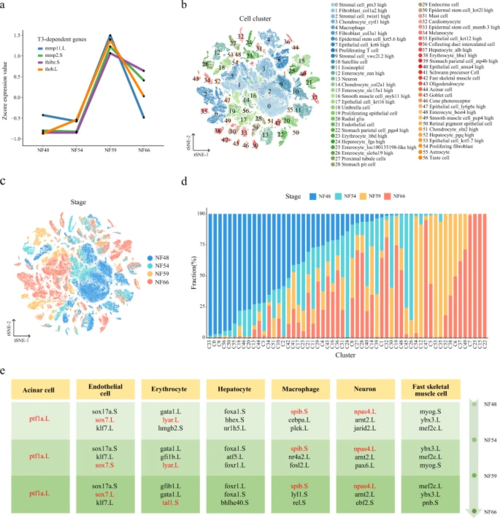
a Expression trajectory of genes regulated by T3 during metamorphosis. b, t-SNE analysis of 188, 020 single cells collected from larval Xenopus. 57 cell-type clusters are labeled in different colors. Cell cluster markers are listed in Supplementary Dataset 1. c t-SNE analysis of 188, 020 single cells collected from larval Xenopus. Stages are labeled in different colors. d Stage proportion in different cell clusters. Stages are labeled in different colors. e dTFs are listed in different stages for cell lineages. Each row represents one stage and each column represents one cell type. The representative TFs for each cell types are labeled by red. |