
Fig. 2
- ID
- ZDB-FIG-220628-60
- Publication
- Wang et al., 2022 - Zebrafish Xenograft Model for Studying Pancreatic Cancer-Instructed Innate Immune Microenvironment
- Other Figures
- All Figure Page
- Back to All Figure Page
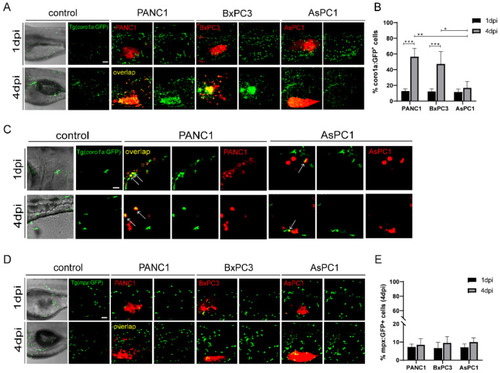
The pancreatic cancer cells show distinct interaction with the innate immune cells in zebrafish. (A) Representative confocal images of Tg(coro1a: GFP)-labeled innate immune cells in PANC1, BxPC3, and AsPC1 xenografts at 1 dpi and 4 dpi. (B) Qualification of innate immune cell percentage in PANC1, BxPC3, and AsPC1 cells at 1 dpi and 4 dpi (no. of innate immune cells/no. of tumor cells × 100). Results are shown as means ± SEM from nine different individuals (* p < 0.05, ** p < 0.01, *** p < 0.001, ANOVA). (C) Enlarged confocal images of innate immune cells co-localized with PANC1 and AsPC1 xenografts at 1 dpi and 4 dpi. Arrows point to the co-localized cells. (D) Representative confocal images of Tg(mpx: GFP)-labeled neutrophils in PANC1, BxPC3, and AsPC1 xenografts at 1 dpi and 4 dpi. (E) Qualification of neutrophils percentage in PANC1, BxPC3, and AsPC1 cells at 1 dpi and 4 dpi (no. of neutrophils/no. of tumor cells × 100). Results are from nine different individuals. dpi, days post injection. Scale bars in (A,D), 50 µm; in (C), 25 µm. |