
Fig. 5
- ID
- ZDB-FIG-220628-63
- Publication
- Wang et al., 2022 - Zebrafish Xenograft Model for Studying Pancreatic Cancer-Instructed Innate Immune Microenvironment
- Other Figures
- All Figure Page
- Back to All Figure Page
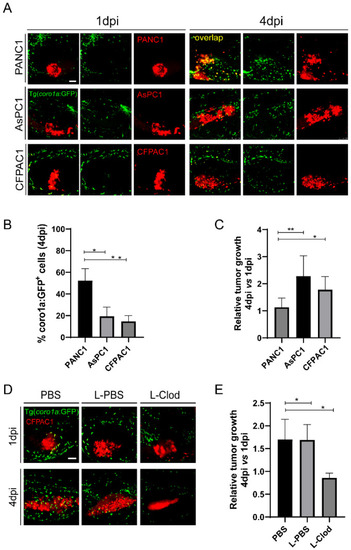
CFPAC1 also hijacks innate immune cells to promote tumor growth in zebrafish. (A) Representative confocal images of PANC1, AsPC1, and CFPAC1 xenografts at 1 dpi and 4 dpi. (B) Qualification of coro1a: GFP+ innate immune cell percentage in PANC1, AsPC1, and CFPAC1 cells at 4 dpi (no. of innate immune cells/no. of tumor cells × 100). Results are shown as means ± SEM from nine different individuals (* p < 0.05, ** p < 0.01, t test). (C) Relative tumor growth of PANC1, AsPC1, and CFPAC1. Results are from nine different individuals (* p < 0.05, ** p < 0.01, t test). (D) Representative confocal images of CFPAC1 xenografts in the embryos co-injected with PBS, L-PBS or liposome-clodronate (L-clodronate) at 1 dpi and 4 dpi. (E) Relative tumor growth of CFPAC1 in PBS-, L-PBS- or L-clodronate-treated groups. Results are from nine different individuals (* p < 0.05, t test). dpi, days post injection. Scale bar, 50 µm. |