
FIGURE
Fig. 4
- ID
- ZDB-FIG-220628-102
- Publication
- Morrison et al., 2022 - Single-cell transcriptomics reveals conserved cell identities and fibrogenic phenotypes in zebrafish and human liver
- Other Figures
- All Figure Page
- Back to All Figure Page
Fig. 4
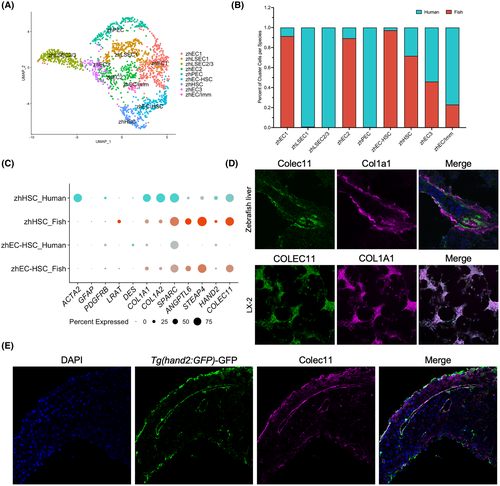
Joint clustering of adult human and zebrafish ECs and HSCs. (A) UMAP visualization of nine clusters comprised of adult human liver and adult zebrafish liver ECs and HSCs. (B) Bar graph showing the percentage of cells contributed to each cluster from each species. (C) Dot plot showing differential expression of HSC marker genes split by species to show marker conservation. (D) Immunofluorescent staining for COLEC11 and COL1A1 on WT adult zebrafish liver cryosections (imaged at magnification ×63) and LX-2 cells (imaged at magnification ×20). (E) Immunofluorescent staining for GFP under the hand2 promoter and COLEC11 on WT adult zebrafish liver cryosections (imaged at magnification ×63). zhEC/Imm, endothelial cell/immune cell mix
|
Expression Data
| Gene: | |
|---|---|
| Antibodies: | |
| Fish: | |
| Anatomical Term: | |
| Stage: | Adult |
Expression Detail
Antibody Labeling
Phenotype Data
Phenotype Detail
Acknowledgments
This image is the copyrighted work of the attributed author or publisher, and
ZFIN has permission only to display this image to its users.
Additional permissions should be obtained from the applicable author or publisher of the image.
Full text @ Hepatol Commun