
FIGURE
Fig. 5
- ID
- ZDB-FIG-220628-103
- Publication
- Morrison et al., 2022 - Single-cell transcriptomics reveals conserved cell identities and fibrogenic phenotypes in zebrafish and human liver
- Other Figures
- All Figure Page
- Back to All Figure Page
Fig. 5
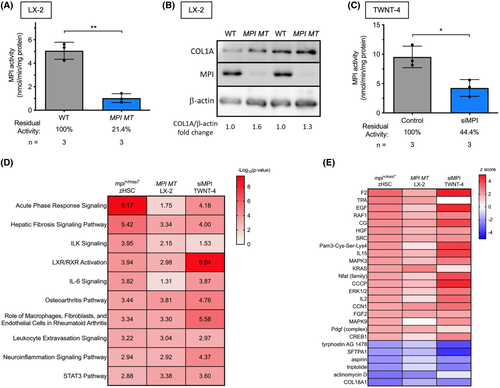
Activation phenotypes are conserved across human and zebrafish HSCs. (A) Bar graph showing MPI enzymatic activity in WT and MPI MT LX-2 cells. (B) Western blot for MPI and COL1A in WT and MPI MT LX-2 cells. (C) Bar graph showing MPI enzymatic activity in control and siMPI TWNT-4s. (D,E) IPA conducted on DGE from the following three data sets: mpi+/mss7 zebrafish single-cell HSCs (zHSCs), MPI mutant LX-2 HSCs, and siMPI TWNT-4 HSCs. Heatmaps display (D) −log10(p values) for canonical pathway activity alteration and (E) z score of activation/inhibition of upstream regulators. *p < 0.05, **p < 0.01. ILK, integrin-linked kinase; LXR, liver X receptor; RXR, retinoid X receptor; STAT3, signal transducer and activator of transcription 3
|
Expression Data
Expression Detail
Antibody Labeling
Phenotype Data
Phenotype Detail
Acknowledgments
This image is the copyrighted work of the attributed author or publisher, and
ZFIN has permission only to display this image to its users.
Additional permissions should be obtained from the applicable author or publisher of the image.
Full text @ Hepatol Commun