
Fig. 4 - supplement 1
- ID
- ZDB-FIG-220621-26
- Publication
- Amini et al., 2022 - Amoeboid-like migration ensures correct horizontal cell layer formation in the developing vertebrate retina
- Other Figures
- All Figure Page
- Back to All Figure Page
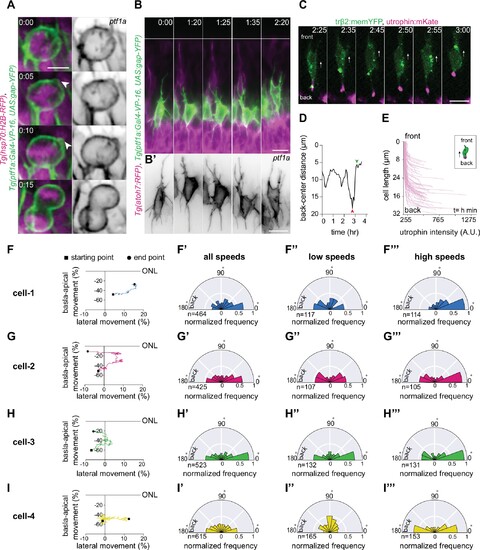
Analysis of HC protrusions. (A) Time-series of a horizontal cell (HC) during mitosis shows that HCs display membrane blebs (white arrowhead) during rounding.Tg(ptf1a:Gal4-VP-16,UAS:gap-YFP) labels HC membrane (green) and Tg(hsp70:H2B-RFP) is expressed in nuclei (magenta). Right panel: HC membrane (gray). Scale bar: 5 μm. (B) Time-lapse sequence of dynamic protrusions of a migrating HC. Protrusions display different morphologies and point in different directions. Tg(ptf1a:Gal4-VP-16,UAS:gap-YFP) labels HC membrane (green). Scale bar: 20 μm. Bottom: close-up of HC membrane (gray). Scale bar: 10 μm. White line: apical surface. (B’) Close-up of HC protrusions from (B). Scale bar: 5 μm. Frames from Video 7. (C) Time series of a migrating HC (green) (labeled by trβ2:memYFP DNA construct) and its dynamically changing uropod (magenta) (labeled by utrophin-mKate DNA construct). Frames from Video 10. (D) Measurements of the length of the uropod relative to HC centroid showing that it undergoes extension (red arrowhead) followed by retraction (green arrowhead). See Figure 4—source data 2. (E) Average utrophin:mKate fluorescent intensity profile of images at (E). See Figure 4—source data 2. (F–I) Migration trajectories and the frequency distribution of the angle between the direction of instantaneous HC movement and its protrusions in four HCs (cell-1, cell-2, cell-3, cell-4); (F’–I’) at all speeds, (F’’–I’’) at low speed: below 25 percentile of that cell’s speed, and (F’’’–I’'') at high speed: speeds above 75 percentile of the cell speed. A protrusion pointing exactly in the direction of cell movement has an angle of 0°, and a protrusion pointing exactly opposite has an angle of 180°. The numbers represent the number of angles observed for each category. The radius indicates the normalized frequency for each angle bin, that is, the number of frames observed with the angle belonging to the particular angle bin for the given velocity condition normalized by the total number of frames observed in the given velocity condition. See Figure 4—source data 1 for (F–I’’’). Time in h:min (A–F). |