
Fig. 4
- ID
- ZDB-FIG-220621-25
- Publication
- Amini et al., 2022 - Amoeboid-like migration ensures correct horizontal cell layer formation in the developing vertebrate retina
- Other Figures
- All Figure Page
- Back to All Figure Page
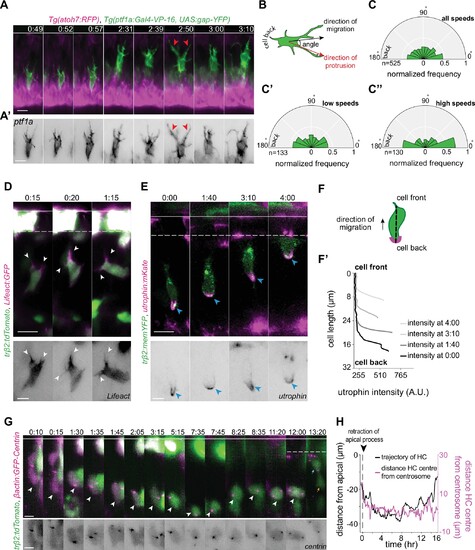
(A) Time-lapse sequence of highly dynamic membrane protrusions pointing in different directions (red arrowheads) in a migrating horizontal cell (HC). Tg(ptf1a:Gal4-VP-16,UAS:gap-YFP) labels membrane of HCs (green), Tg(atoh7:RFP) marks retinal ganglion cells (RGCs) and photoreceptors (PRs). Time interval = 1 min. Scale bar: 50 μm. (A’) Higher magnification insets of HC cell membrane from (A). Scale bar: 5 μm. (B) Scheme of protrusion angles measurements. (C–C’’) The frequency distribution of the angle between the direction of instantaneous movement of HC and its protrusions; (C) throughout the tracked basal-to-apical journey (t=4 hr), (C’) at low speeds: speeds below 25 percentile of this HC’s speed (<0.38 μm/min), (C’’) at high speeds: above 75 percentile of this HC’s speed (>0.93 μm/min). Minimum and maximum speeds observed for this cell are 0.06 and 4.44 µm/min, respectively. A protrusion pointing exactly toward the direction of cell movement exhibits an angle of 0°, and a protrusion pointing exactly opposite exhibits an angle of 180°. The radius indicates the normalized frequency for each angle bin, that is, the number of frames observed with the angle belonging to the particular angle bin for the given velocity condition normalized by the total number of frames observed in the given velocity condition. All measurements are from the migrating HC in (A–A’). See Figure 4—source data 1. (D–F’) F-actin distribution in migrating HCs: (D) trβ2:tdTomato and Lifeact-GFP DNA constructs mark HCs (green) and all filamentous F-actin (magenta), respectively. Lifeact-GFP is detected in the leading protrusions (white arrowheads) and the cell cortex. Scale bar: 20 μm. Bottom: close-up of Lifeact-GFP (gray) from (D). Scale bar: 5 μm. (E) trβ2:memYFP is expressed in HCs (green) and utrophin-mKate marks the stable filamentous F-actin (magenta). Utrophin is enriched at the cell back (blue arrowheads). Scale bar: 20 μm. Bottom: high magnification of utrophin:mKate (gray) in migrating HC from (E). Scale bar: 5 μm. (F) Scheme of line scan measurements of utrophin:mKate fluorescence intensity. (F’) Average utrophin:mKate fluorescent intensity profile of images at (E). Cell front and back are determined by the direction of HC movement. See Figure 4—source data 2. (G–H) Time series showing the dynamics of centrosome position in HCs from birth to final positioning. (G) β-actin:GFP-Centrin and trβ2:tdTomato DNA plasmids label centrosomes (magenta) and HCs (green), respectively. White arrowhead: HC. Cyan and orange arrows: sister HCs after mitosis. Bottom panel shows close-up of β-actin:GFP-Centrin (gray) in the tracked HC. White line: apical surface; dashed white line: HC layer. Scale bar: 20 μm. (H) Graph showing migration trajectory of the represented HC (black line) and the distance between its centrosome and center (magenta line) throughout migration. Arrowhead: time of detachment of the apical process. See Figure 3—source data 2, Figure 3—source data 3. Time in h:min (A–G). See also Figure 4—figure supplements 1 and 2.
|