
FIGURE
Fig. 10
Fig. 10
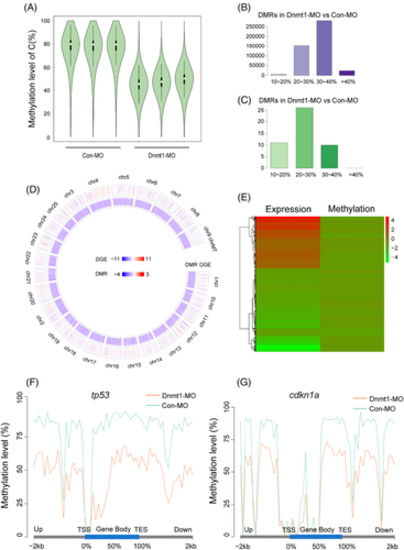
WGBS analysis detects global hypomethylation after knocking down Dnmt1. A, The violin diagrams show global methylation levels in Con-MO group and Dnmt1-MO group with three repeats. The white dot indicates median, the black solid frame indicates interquartile range (IQR), the thin black line indicates data range and the width of violin indicates the distribution density. B-C, The number of DMRs with hypomethylation (B) and hypermethylation (C) in Dnmt1-MO group compared to Con-MO group. The abscissa represents different methylation levels. D, Circos figure displays the general distribution of DEGs and DMRs in genome Dnmt1-MO group compared to Con-MO group. The chromosome number, the DEGs (RNA-Seq) and DMRs (CpG) are present from the outer ring to the inner ring. Red indicates upregulation, blue indicates downregulation; the darker the colour, the greater the difference. E, The heat map shows the common DEG- and DMR-related genes in Dnmt1-MO group compared to Con-MO group. Red indicates upregulation and green indicates downregulation. F-G, The methylation levels of tp53 and cdkn1a in the functional region are all significantly reduced in Dnmt1-MO morphants compared to the Con-MOs. TES, transcription end site; TSS, transcription start site
|
Expression Data
Expression Detail
Antibody Labeling
Phenotype Data
Phenotype Detail
Acknowledgments
This image is the copyrighted work of the attributed author or publisher, and
ZFIN has permission only to display this image to its users.
Additional permissions should be obtained from the applicable author or publisher of the image.
Full text @ Cell Prolif.