FIGURE

Figure 4

ID
ZDB-FIG-220507-16
Publication
Dekens et al., 2022 - Melanopsin elevates locomotor activity during the wake state of the diurnal zebrafish
Other Figures
All Figure Page
Back to All Figure Page
Figure 4

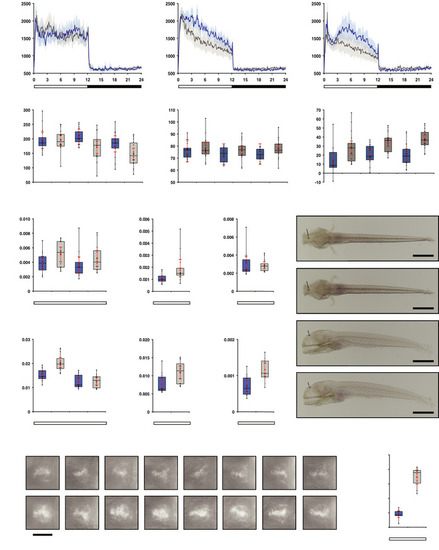
opn4 dko larvae display attenuated locomotor activity in the wake state.

A-C   Actograms show mean locomotor activity of wild‐type (blue line) and opn4 dko (grey line) larvae at (A) 5 dpf, (B) 6 dpf and (C) 7 dpf. The band on each side of the mean indicates the confidence interval (95%). The bar under the chart indicates the 12:12 h LD regime.

D   Box plot shows reduced locomotor activity during the wake state in opn4 dko larvae (grey box) when compared to wild‐type (blue box) at 6 and 7 dpf. All activity bins in the light phase of each larva were pooled separately, thus the aggregated activity data of each larva on one particular day is in this case one single observation in the test statistics. As the consecutive days are presented separately, the assumption of independent identical observations is fulfiled.

E   Plot as in (D) for the rest state, shows no difference at 5 and 6 dpf and a significantly raised activity of the opn4 dko at 7 dpf.

F   opn4 dko larvae show significant more displacement in large‐angle turns at the onset of the dark interval than wild‐type on the 5th, 6th and 7th dpf (see also Fig EV3A–C

G   Plot shows asmt mRNA levels, detected by qPCR, in whole wild‐type (blue box) and whole opn4 dko (grey box) larvae at 6 dpf.

H   Plot shows a significant higher asmt mRNA level in the ophthalmectomised opn4 dko larvae than ophthalmectomised wild‐type larvae at ZT3 on the 6th dpf.

I   Plot shows similar asmt mRNA levels between opn4 dko eyes and wild‐type eyes at ZT3 on the 6th dpf.

J   ish with asmt probe on larvae sampled on the 6th dpf at ZT3 shows that asmt mRNA is confined to the pineal and indicates that the asmt gene is not ectopically expressed in opn4 dko larvae. The higher asmt mRNA level measured by qPCR in the opn4 dko therefore points at a defect in the pineal. Note that the eyes were removed after the ish for optimal visibility of expression in the brain. Scale bar: 0.5 mm.

K   Plot as in (G), shows significant higher levels of ddc mRNA in whole opn4 dko larvae at ZT3.

L   Plot as in (H), shows significant higher levels of ddc mRNA in ophthalmectomised opn4 dko at ZT3.

M   Plot as in (I), shows significant higher levels of ddc mRNA in opn4 dko eyes at ZT3.

N   ish with ddc probe on wild‐type and opn4 dko larvae sampled on the 6th dpf represents ddc expression in pineals. Whole larvae are presented in Appendix Fig S2. Biological replicates indicated with BR. Scale bar: 0.05 mm.

O   Quantification of the adjusted intensity in the pineals from larvae presented in (N), implies a significant higher ddc transcript level in the opn4 dko pineal.

Data information: In (D–I), (K–M) and (O), boxplot divides the data in quartiles: the box indicates the interquartile range, with the horizontal line in the box denoting the median of the data set, the whiskers extend to the minimum and maximum, and meet the box at the median of the lower (quartile 1) and median of the upper (quartile 3) half of the dataset. Black dots indicate biological replicates (D–F: n = 18, G–I and K–M: n = 12, O: n = 8), the red dot indicates the mean, red error bars indicate the confidence interval (95%), asterisks indicate significance (0.01 < P(*) < 0.05, 0.001 < P(**) < 0.01, P(***) < 0.001, ns = not significant).

Expression Data
Genes:
Fish:
Anatomical Terms:
Stage: Day 6

Expression Detail
Antibody Labeling
Phenotype Data
Fish:
Observed In:
Stage Range: Day 5 to Days 7-13

Phenotype Detail
Acknowledgments
This image is the copyrighted work of the attributed author or publisher, and ZFIN has permission only to display this image to its users. Additional permissions should be obtained from the applicable author or publisher of the image. Full text @ EMBO Rep.