
Figure EV3
- ID
- ZDB-FIG-220507-19
- Publication
- Dekens et al., 2022 - Melanopsin elevates locomotor activity during the wake state of the diurnal zebrafish
- Other Figures
- All Figure Page
- Back to All Figure Page
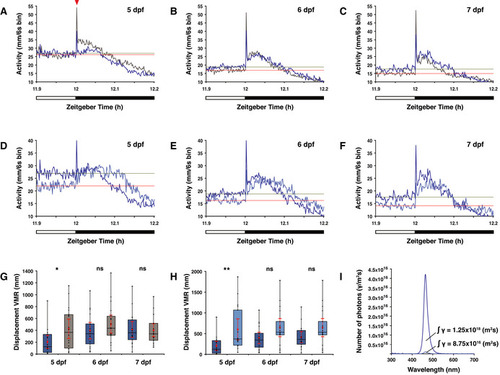
Overview of visual motor response (VMR) data A–C Actograms show the mean activity of wild‐type (dark blue line) and D–F Actogram shows mean activity of wild‐type larvae under a medium (dark blue line) or low (light blue line) intensity LD 12:12 h regime at the light to dark boundary on the (D) 5th dpf, (E) 6th dpf and (F) 7th dpf. Solely for estimation, the mean activity over the last 6 min in the light phase is plotted as a horizontal line for larvae under medium light intensity (green) and low light intensity (red). G opn4 dko larvae (grey box) show similar displacement in routine turns after transition from light to darkness as wild‐type (blue box) on the 6th and 7th dpf, but not on the 5th dpf ( H Wild‐type larvae show similar displacement in routine turns after transition from light to darkness under a low (light blue box) as under a medium (dark blue box) intensity LD regime on the 6th and 7th dpf, but not on the 5th dpf ( I Plot of the photon flux at medium (dark blue line) and low (light blue line) light intensities. For biological processes, the photon flux has a higher relevance than the irradiance (power of electromagnetic radiation) because a photoreceptor is activated by a photon. The photon flux is defined as the number of photons (γ) per unit area (m2/s). Data information: In (G) and (H), boxplot divides the data in quartiles: the box indicates the interquartile range, with the horizontal line in the box denoting the median of the data set, the whiskers extend to the minimum and maximum, and meet the box at the median of the lower (quartile 1) and median of the upper (quartile 3) half of the dataset. Black dots indicate biological replicates ( |