
Fig. 4
- ID
- ZDB-FIG-220506-33
- Publication
- Dai et al., 2022 - Transcriptome-wide subtyping of pediatric and adult T cell acute lymphoblastic leukemia in an international study of 707 cases
- Other Figures
- All Figure Page
- Back to All Figure Page
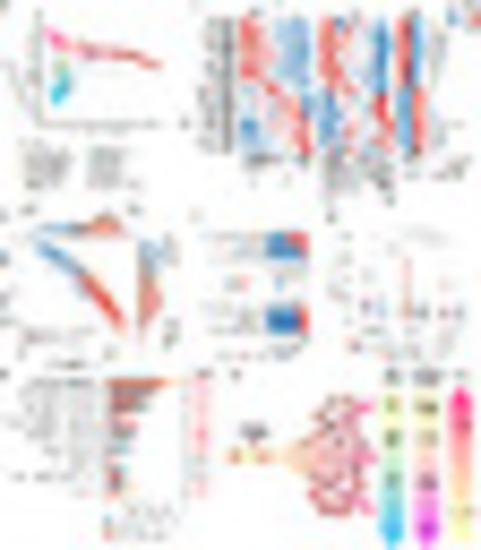
Dimensionality reduction analysis revealing T cell development in different subtypes. (A) Visualization of the dimensions calculated by diffusion map using 707 T-ALL patients. The top 5% variance genes in RNA-seq data are subjected to diffusion map analysis and the first three diffusion components are visualized using three-dimensional plots. Each point represents one sample. (B) Gene-expression patterns of signatures of different functional clusters. These clusters were differentially expressed in different T cell stages. The Left heatmap shows the expression levels of functional clusters in different T cell stages, the Middle heatmap shows the expression levels in different subtypes, while the Right heatmap shows the expression levels in different branches. Expression is calculated using the mean value of the genes and then scaled as the row z-score. (C) Scatter and density plot of enrichment score (ES) for ETP and precortical signatures in different dysregulated leukemogenic factor branches. (D) Bar plot of the percentage of patients according to age (Upper) and gender (Lower) in each dysregulated leukemogenic factor branch. P values are calculated using a χ2 test. (E) Violin plot of mutation counts identified in RNA-seq of each branch. The outline color represents age information and the internal boxplot represents the three branches. P values are calculated using Wilcoxon rank-sum test. (F) Comparisons of different functional categories of mutations in the three branches. P values are calculated using Fisher’s exact test. (G) Model of the association between the accumulation of genetic abnormalities, the dysregulation of leukemogenic factors, T cell stages, and age in T-ALL leukemogenesis. |