
Fig. 2
- ID
- ZDB-FIG-220506-31
- Publication
- Dai et al., 2022 - Transcriptome-wide subtyping of pediatric and adult T cell acute lymphoblastic leukemia in an international study of 707 cases
- Other Figures
- All Figure Page
- Back to All Figure Page
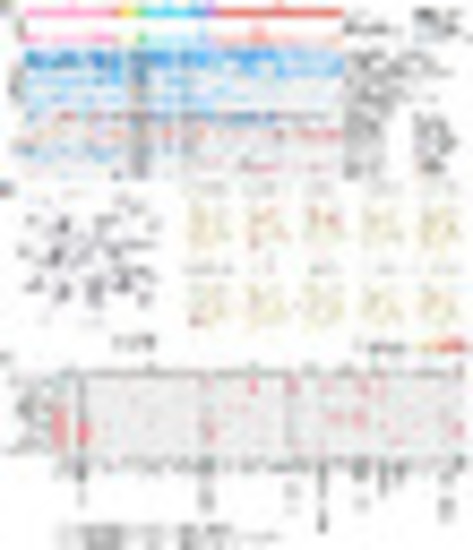
The landscape of molecular interaction and pairwise relationship between nonsilent gene mutations. (A) Profiling of nonsilent gene mutations identified in 707 T-ALL RNA-seq. Mutation counts, gene mutations with high frequencies, and mutations in different categories are illustrated in three panels. In the Top, the number of mutations identified in RNA-seq data are illustrated as a barplot. In the Middle, genes with over 10% mutation frequency in T-ALL, as well as USP7 (9.5%) and GATA3 (used to discriminate GATA-mut subtype), are visualized. In the Bottom, mutation events in different categories are summarized using a blue label. (B, Left) Network visualization of mutated genes with edges defined by the knowledge of gene interactions from KEGG pathways. (Right) The same network but with nodes color-coded by the subtype-specific mutation frequency. (C) Comparison of the percentage of mutations in each subtype. Tendencies of cooccurrence and independence/exclusivity between gene mutations and subtypes are calculated, respectively. Red pies represent statistically significant cooccurrence, blue ones indicate statistically significant exclusivity, while gray ones show tendencies of gene mutation relationship that does not reach to statistical significance. Statistical significance of cooccurrence and exclusivity is calculated by comparing the mutations frequency in this subtype with other subtypes using χ2 test (when cases in all conditions >5) or Fisher’s exact test. Due to the limited sample sizes in some subtypes, some tendencies of relationship between gene mutations and subtypes could not always reach to statistical significance. Statistical results between mutations and subtypes are listed in Dataset S6. |