
Fig. 4
- ID
- ZDB-FIG-220429-20
- Publication
- Matrone et al., 2021 - Fli1+ cells transcriptional analysis reveals an Lmo2-Prdm16 axis in angiogenesis
- Other Figures
- All Figure Page
- Back to All Figure Page
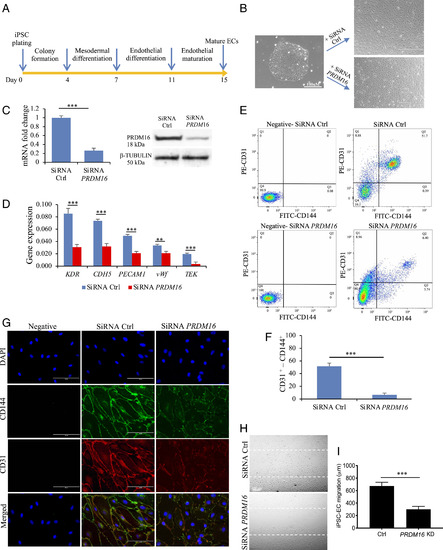
Assessment of PRDM16 function in iPSC-EC. (A) Differentiation protocol for the generation of iPSC-derived ECs (see details in Methods). At day 7, cells were incubated with siRNA control (Ctrl) or targeting PRDM16. (B) Brightfield images of an iPSC colony and of the iPSC-derived ECs, showing a different phenotype following treatment with SiRNA for PRDM16. (C) qPCR bar graph and Western blot showing the reduced expression of PRDM16 mRNA and protein in cells following PRDM16 siRNA treatment. (D) qPCR data showing the reduced expression of endothelial markers in iPSC-derived EC following PRDM16 KD. (E) FACS analysis for the endothelial markers CD31 and CD144 in iPSC-EC showing a significantly reduced population of CD31+-CD144+ in PRDM16 KD cells compared with controls, as shown in the bar graph in F. In negative samples, no first antibodies were added. (G) Immunofluorescence staining for endothelial markers CD31 and CD144 (vascular endothelial (VE)-Cadherin). iPSC-EC with no first antibodies added were used as negative control. (H) Migration assay in iPSC-EC showed that PRDM16 KD reduces cell migration, as shown by a larger residual gap between the edges of the wounded monolayer, quantified in I. n = 3 experiments; Student’s t test, ***P ≤ 0.001, **P ≤ 0.01, compared with controls. |