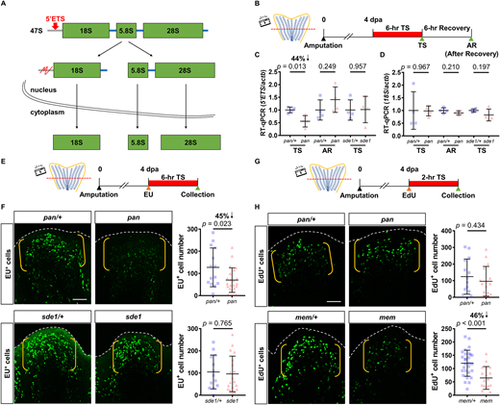
Ddx52 maintains 47S pre-rRNA and bulk RNA transcriptions in proliferating tissues. (A) Illustration depicting the processing of ribosomal RNAs. Once transcribed, the 47S pre-rRNA is immediately processed into 18S, 5.8S and 28S rRNAs. Red arrow points to the 5′-external transcribed space (5′ETS), the level of which often serves as a readout for the quantity of 47S pre-rRNA. (B) Timeline of the temperature shift experiment during tailfin regeneration. AR, after recovery at 26°C; dpa, days post-amputation; TS, temperature shift. Red bar indicates time at 34°C. (C) RT-qPCR assay indicating a marked reduction in the 5′ETS level after a 6-h incubation at 34°C. qPCR results were normalized to actb (n=4 per group; mean±s.e.m.; two-tailed Student's t-test). (D) RT-qPCR assay indicating no change in the 18S level after a 6-h incubation at 34°C. qPCR results were normalized to actb (n=4 per group; mean±s.e.m.; two-tailed Student's t-test). (E) Timeline of the temperature shift and EU assay during tailfin regeneration. Orange arrowhead marks the EU injection time. TS, temperature shift. Red bar indicates time at 34°C. (F) Whole-mount EU staining of pan and sde1 tailfin regenerates at 4 dpa after a 6-h incubation at 34°C. White dashed lines outline the distal margin of the fin tissue. Yellow brackets mark the blastema compartment. Scale bar: 50 μm. Graphs show quantification of EU+ cells in the lateral 2nd bony ray (n=24 pan/+, 22 pan; 13 sde1/+, 19 sde1; mean±s.d.; two-tailed Student's t-test). (G) Timeline of the temperature shift and EdU assay during tailfin regeneration. Orange arrowhead marks the EdU injection. Red bar indicates time at 34°C. (H) Whole-mount EdU staining of pan and mem tailfin regenerates at 4 dpa after a 2-h incubation at 34°C. White dashed lines outline the distal margin of the fin tissue. Yellow brackets mark the blastema compartment. Scale bar: 50 μm. Graphs show quantification of EdU+ cells in the lateral 2nd bony ray (n=14 pan/+, 16 pan; 28 mem/+, 18 mem; mean±s.d.; two-tailed Student's t-test).
|
